NeuAIs Internal Documentation
Internal documentation for developers and operations
This documentation is for the NeuAIs development team and covers internal architecture, integration details, and operational procedures.
🎯 For New Team Members
Start here:
- Quick Start Guide - Set up your development environment
- Development Tools - IDE, Git, and automation tools
- Control Panel Guide - Using the management interface
📖 Documentation Sections
Getting Started
Essential guides for setting up and running the platform locally.
- Quick Start - 3-step setup guide
- Development Tools - IDE and Git server setup
- Control Panel - Dashboard usage
Observatory
Deep dives into the 3D visualization system.
- Visual Customization - Colors, shapes, themes
- Agent Connection - How agents connect to Observatory
Integration
Technical integration guides for various systems.
- SMO/RIC Integration - O-RAN architecture
- Model Inventory - ML model management
- GitArena/Lapdev - Tool rebranding
Management
Team operations and management documentation.
- Team Operations Plan - How we work together
Architecture
Deep technical architecture documentation.
- O-RAN SMO/RIC - O-RAN architecture documents and diagrams
🔧 Quick Links
Development:
- Main README - Project overview
- Observatory README - Observatory docs
- External Docs - Public documentation
- Prebuilds Cache - Nix prebuilts DB (
cache.db, populate/query usage)
Configuration:
- Dev Config - Development configuration
- Prod Config - Production configuration
- Staging Config - Staging configuration
Management:
- Compliance - Compliance documentation
- Dev Team - Development team docs
- Operations - Operational runbooks
🌐 External Resources
Public Documentation:
- https://docs.neuais.com - Public-facing documentation
- https://observatory.neuais.com - Observatory application
- https://github.com/neuais/platform - GitHub repository
📝 Documentation Standards
Writing Style
- Clear and concise
- Code examples for everything
- Step-by-step instructions
- Troubleshooting sections
Formatting
- Markdown format
- GitBook-compatible structure
- Code blocks with language tags
- Tables for structured data
Updates
- Keep docs synchronized with code
- Update on every major change
- Version documentation
- Archive outdated docs
🤝 Contributing to Docs
Adding New Documentation
- Create markdown file in appropriate directory
- Add to
SUMMARY.md - Follow existing structure
- Include code examples
- Add troubleshooting section
Updating Existing Docs
- Make changes in place
- Update “Last updated” date
- Test all code examples
- Verify links work
Doc Structure
# Title

Brief introduction (1-2 paragraphs)

## Section 1

Content with code examples

## Section 2

More content

---

Last updated: YYYY-MM-DD
📊 Documentation Status
| Section | Status | Last Updated |
|---|---|---|
| Getting Started | ✅ Current | 2025-12-12 |
| Observatory | ✅ Current | 2025-12-12 |
| Integration | ⚠️ Partial | 2025-12-10 |
| Management | ✅ Current | 2025-12-08 |
| Architecture | ✅ Current | 2025-12-09 |
🐛 Found an Issue?
Documentation bugs:
- Check if already reported
- Create issue with details
- Suggest correction
- Submit PR if you can fix it
Code bugs:
- Use GitHub Issues
- Include reproduction steps
- Attach logs/screenshots
Last updated: December 12, 2025
Quick Start
Get NeuAIs running in 3 simple steps
This guide will get you up and running with both Observatory (3D visualization) and Perfection (automation system).
Prerequisites
Required:
- Python 3.9+ (for local web server)
- Web Browser (Chrome 90+, Firefox 88+, Edge 90+)
Optional (for full platform):
- Rust 1.70+ (for IDE and Git tools)
- Go 1.21+ (for services and Perfection)
- Node.js 20+ (for dashboard and tools)
- PostgreSQL 14+ (for IDE/Git data storage)
Quick Start: Observatory (Recommended)
Launch the 3D visualization interface in 30 seconds:
Step 1: Navigate to Observatory
cd neuais.com/hub.neuais.com/observatory.neuais.com
Step 2: Start Web Server
python3 -m http.server 3000
Step 3: Open in Browser
Visit: http://localhost:3000/start.html
What you’ll see:
- Beautiful landing page with animated starfield
- “Launch Observatory” button
- 3D constellation of agents, services, and infrastructure
- Interactive controls (drag, zoom, click)
Alternative: Perfection Automation
Generate complete systems from CSV manifests:
Step 1: Navigate to Automation
cd neuais.com/automation
Step 2: Generate System
./cli/perfection generate manifest/neuais-complete.csv
This creates:
- 19 backend services (Go HTTP + gRPC)
- 9 AI agents (Rust + Go with GPT-4/Claude)
- 3 infrastructure configs (PostgreSQL, Redis, Consul)
- 7 frontend components (React/TypeScript)
- 6 documentation files (MkDocs)
Generation time: ~10 seconds
Output location: automation/generated/
Step 3: View in Control Panel
cd frontend/dashboard
node server.js
Visit: http://localhost:3002
Full Platform Setup (Optional)
For complete development environment with IDE and Git tools:
1. Build Development Tools
First time only - compiles Rust binaries (5-15 minutes):
cd neuais.com/automation
./build-tools.sh
This compiles:
- NeuAIs IDE (Lapdev) - Web-based IDE with terminal, LSP, extensions
- NeuAIs Git (GitArena) - Self-hosted Git with issues and code review
2. Setup PostgreSQL
Required for IDE and Git tools:
# Install PostgreSQL (if not already installed)
# Ubuntu/Debian:
sudo apt install postgresql

# macOS:
brew install postgresql
brew services start postgresql

# Create database
./automation/setup-postgres.sh
3. Start All Services
cd neuais.com/automation
./start-all.sh
This starts:
- Control Panel Dashboard (port 3002)
- NeuAIs IDE (port 3001)
- NeuAIs Git (port 3000)
Access Points
Primary Applications
| Application | URL | Purpose |
|---|---|---|
| Observatory | http://localhost:3000/start.html | 3D visualization ⭐ |
| Control Panel | http://localhost:3002 | Manage services/agents |
| IDE | http://localhost:3001 | Code editor |
| Git | http://localhost:3000 | Repository management |
Documentation
| Resource | URL | Description |
|---|---|---|
| External Docs | https://docs.neuais.com | Public documentation |
| Internal Docs | docs-internal/README.md | Internal guides |
| Observatory Docs | hub.neuais.com/observatory.neuais.com/README.md | Observatory guide |
What You Can Do
In Observatory (3D View)
- Explore the system - Drag to rotate, scroll to zoom
- Click nodes - View detailed information cards
- Use the dock - Hover at bottom for tools
- Customize visuals - Change colors and shapes
- View metrics - Real-time performance data
- Access terminal - Execute commands
- Capture screenshots - Save visualization as PNG
In Control Panel (Dashboard)
- View all components - Services, agents, docs in cards
- Start/stop services - Click “Start” on any service or agent
- View code - Click “Code” to open in IDE
- Read documentation - Click on documentation cards
- Access tools - Quick links to IDE and Git
Usage Workflows
Observatory Workflow
Typical user flow:
- Open Observatory → See 3D visualization
- Explore nodes → Click for details
- Check metrics → Open metrics card
- View topology → See connections
- Customize → Adjust colors/shapes
- Monitor → Watch real-time updates
Automation Workflow
Development flow:
- Edit CSV manifest → Define services/agents
- Run
./cli/perfection generate→ Generate code - Open Control Panel → View all components
- Click “Start” → Launch services/agents
- Click “Code” → Edit in NeuAIs IDE
- Commit → Push via NeuAIs Git
- Deploy → Services auto-connect
Scaling Workflow
For 1000+ agents:
Same workflow, scales automatically:
- Manifest with 1000 entries
- Control Panel shows all 1000
- Observatory visualizes all
- Start/stop individually or in groups
- No architectural changes needed
Troubleshooting
Port already in use
# Find what's using the port
lsof -i :3002  # or :3001, :3000

# Kill it
kill <PID>
Build fails
# Update Rust
rustup update

# Clean build
cd neuais.com/tools/ide/lapdev-lapdev-cli
cargo clean
cargo build --release -p lapdev-ws
Dashboard shows no data
# Regenerate manifest
cd neuais.com/automation
./cli/perfection generate manifest/neuais-complete.csv

# Check manifest exists
ls -lh frontend/dashboard/generated.manifest.json
IDE/Git won’t start
# Check if binaries exist
ls neuais.com/tools/ide/lapdev-lapdev-cli/target/release/lapdev-ws
ls neuais.com/tools/git/gitarena/target/release/gitarena

# If missing, rebuild
./build-tools.sh
Database connection fails
# Check PostgreSQL is running
systemctl status postgresql

# Or
brew services list | grep postgresql

# Create database if needed
./automation/setup-postgres.sh
Configuration
Observatory Settings
Location: Browser localStorage (automatic)
Customizable:
- Colors and shapes
- Particle effects
- Auto-rotation
- Quality settings
Reset: Customize card → “Reset to Default”
Perfection Configuration
Config files:
config/dev.toml- Developmentconfig/prod.toml- Productionconfig/staging.toml- Staging
Environment variables:
export NEUAIS_ENV=dev
export NEUAIS_LOG_LEVEL=debug
export NEUAIS_API_URL=http://localhost:8080
Next Steps
Learn More
Documentation:
- Control Panel Guide - Dashboard usage
- Observatory Customization - Visual config
- Agent Integration - O-RAN SMO/RIC
- Architecture Overview - Platform architecture
External Docs:
- Public Documentation - User guides
- Observatory Guide - 3D visualization
- API Reference - REST API
Try These
Observatory:
- Click the “Customize” icon in dock
- Change agent colors to purple
- Enable/disable particle flows
- Take a screenshot
Automation:
- Edit
manifest/neuais-complete.csv - Add a new agent
- Regenerate with Perfection
- View in Control Panel
Support
Documentation:
- Internal:
docs-internal/ - External: https://docs.neuais.com
- Observatory:
hub.neuais.com/observatory.neuais.com/README.md
Logs:
- Automation:
automation/logs/ - Services:
automation/generated/services/*/logs/ - Browser: F12 Developer Console
Community:
- GitHub Issues: https://github.com/neuais/platform/issues
- Discussions: https://github.com/neuais/platform/discussions
Last updated: December 12, 2025
Running NeuAIs Development Tools
Prerequisites
- Generate tool configs:
cd neuais.com/automation
./cli/perfection generate manifest/neuais-complete.csv
- Setup Postgres database:
createdb neuais
Start NeuAIs Git
cd neuais.com/automation
./run-gitarena.sh
Accessible at: http://localhost:3000
First time setup:
- Create admin account via web UI
- Update settings table in database to enable admin panel
- Access admin panel at: http://localhost:3000/admin
Start NeuAIs IDE
cd neuais.com/automation
./run-lapdev.sh
Accessible at: http://localhost:3001
First time setup:
- Create user account
- Configure Kubernetes cluster (if using K8s features)
- Create workspace
Configuration Files
Generated at:
generated/tools/git/config.env- GitArena configgenerated/tools/ide/config.env- Lapdev config
Edit environment variables:
BIND_ADDRESS- Server addressDATABASE_URL- Postgres connection stringINSTANCE_NAME- Display nameTHEME- UI theme (dark)
Verify
# Check GitArena
curl http://localhost:3000/health

# Check Lapdev
curl http://localhost:3001/health
Troubleshooting
Build errors:
- Ensure Rust toolchain installed:
rustup update stable - Check cargo version:
cargo --version
Database errors:
- Verify Postgres running:
pg_isready - Check connection string in config.env
- Create database:
createdb neuais
Port conflicts:
- Change ports in manifest CSV
- Regenerate configs
Integration with Manifest
Both tools are defined in automation/manifest/neuais-complete.csv:
tool,git,NeuAIs Git server,gitarena,rust,...,3000
tool,ide,NeuAIs IDE server,lapdev,rust,...,3001
When manifest changes, regenerate configs:
./cli/perfection generate manifest/neuais-complete.csv
Branding
Both tools use NeuAIs branding:
- Logo: Black lightning bolt
- Colors: Black, white, grey only
- Theme: Dark mode default
- Instance names: “NeuAIs Git”, “NeuAIs IDE”
Branding applied via:
- CSS overrides (
neuais-brand.css) - HTML templates
- Config defaults
Location: docs-internal/guides/
Related: docs-internal/integration/gitarena-lapdev-rebranding.md
Control Panel Usage
The NeuAIs Control Panel provides a unified interface for managing generated services, agents, and documentation.
Starting the Platform
Quick Start (All Components)
cd neuais.com/automation
./start-all.sh
This starts:
- Control Panel Dashboard (port 3002)
- NeuAIs IDE (port 3001)
- NeuAIs Git (port 3000)
Individual Components
# Dashboard only
cd automation/frontend/dashboard
node server.js

# IDE only
./automation/run-lapdev.sh

# Git only
./automation/run-gitarena.sh
Control Panel Features
Access at: http://localhost:3002
Dashboard Overview
Stats Panel:
- Total services count
- Total agents count
- Documentation files count
- Currently running components
Services Management
Each service card shows:
- Service name and description
- Language and port
- Current status (Running/Stopped)
Actions:
- Start: Launch the service
- Logs: View service logs
- Code: Open source code in IDE
Agents Management
Each agent card shows:
- Agent name and description
- Language and template type
- Current status
Actions:
- Start: Launch the agent
- Logs: View agent logs
- Code: Open source code in IDE
Documentation
Each documentation card shows:
- Doc name and type
- Visibility (Public/Internal)
- Format and template
Actions:
- View: Read documentation
- Edit: Edit doc in IDE
Development Tools
Quick access to:
- NeuAIs IDE - Click to open IDE at port 3001
- NeuAIs Git - Click to open Git at port 3000
- Documentation - View generated docs
Integration with IDE
When clicking “Code” on any service or agent:
- Dashboard opens NeuAIs IDE
- IDE navigates to generated code directory
- User can edit, terminal, LSP all work
Integration with Git
Services and agents can be:
- Viewed in dashboard
- Edited in IDE
- Committed via NeuAIs Git
- Pushed to repository
Generated from Manifest
The dashboard reads generated.manifest.json which contains:
- All services from manifest
- All agents from manifest
- All documentation from manifest
- Dependencies and policies
When manifest changes:
- Run:
./cli/perfection generate manifest/neuais-complete.csv - Dashboard auto-updates with new data
Workflow
Standard Development Flow
- Define - Edit CSV manifest
- Generate - Run perfection CLI
- View - Open control panel dashboard
- Start - Launch services/agents from dashboard
- Edit - Open code in NeuAIs IDE
- Commit - Push changes via NeuAIs Git
- Deploy - Services connect to SMO/RIC
For 1000 Agents
Same workflow, scales automatically:
- Manifest with 1000 entries
- Dashboard shows all 1000
- Start/stop individually or in groups
- Filter and search coming soon
Known Limitations
Current state:
- Start/stop buttons show alerts (backend coming)
- Status is static (needs status API)
- Logs viewer not yet implemented
- No filtering or search yet
Future:
- Real process management
- Live status updates via WebSocket
- Log streaming
- Bulk operations
- Agent grouping
This dashboard is part of the manifest-driven generation system. It automatically reflects whatever is defined in the CSV.
Perfection System
The unified dev environment generator that makes everything.
What is Perfection?
One manifest generates:
- Services (APIs, databases, workers)
- Agents (AI, validators, optimizers)
- Dev Environments (IDE, tools, configs)
- Infrastructure (monitoring, logging, networking)
All from ONE CSV file.
Quick Example
Input: my-stack.csv
type,name,template,language,packages
service,api,go-http,go-1.22,postgresql-17+redis-7
agent,auth,ai-agent,rust-1.91,postgresql-17
frontend,dashboard,react-vite,node-20,none
Output:
perfection generate my-stack.csv
perfection deploy api --platform fly.io

# ✅ Service running on Fly.io
# ✅ Agent registered with RIC
# ✅ All configs generated
Installation
Pre-built Binary (Recommended)
cd perfection/cli
./target/release/perfection --help

# Add to PATH
sudo ln -s $(pwd)/target/release/perfection /usr/local/bin/
Docker Image
cd perfection
docker build -t perfection:latest .
docker run perfection:latest --help
From Source
cd perfection/cli
cargo build --release
Commands
Initialize
perfection init
# Tests database, Redis, RIC connections
List Resources
perfection list environments     # Templates
perfection list packages         # Dependencies
perfection list agents           # Registered agents
perfection list extensions       # IDE extensions
Generate Configs
perfection generate manifest.csv

# Creates:
# - Dockerfiles
# - fly.toml
# - dev.nix
# - .env templates
Deploy
# Local (Docker)
perfection deploy api --platform local

# Fly.io (Cloud)
perfection deploy api --platform fly.io

# With health check
perfection deploy api
Monitor
perfection status              # All deployments
perfection status api          # Specific service
perfection logs api            # View logs
perfection logs api --follow   # Stream logs
Stop
perfection stop api
Configuration
Environment Variables
# Database (required)
export PERFECTION_DB_HOST=localhost
export PERFECTION_DB_PORT=5432
export PERFECTION_DB_NAME=perfection
export PERFECTION_DB_USER=postgres
export PERFECTION_DB_PASSWORD=your_password

# Redis (optional)
export PERFECTION_REDIS_URL=redis://localhost:6379

# RIC (for agents)
export RIC_ENDPOINT=https://micro-ai-staging.dicerollerdnd.workers.dev

# Fly.io (for cloud deployment)
export FLY_API_TOKEN=your_token
Database Setup
# Create database
createdb perfection

# Run migrations
cd perfection
psql -d perfection < schema/001_perfection_schema.sql
psql -d perfection < schema/002_seed_environments.sql
Manifest Format
Required Fields
type- service, agent, devenv, tool, frontendname- Unique identifiertemplate- Base template to uselanguage- Language and version (rust-1.91, go-1.22)packages- Dependencies (postgresql-17+redis-7)
Optional Fields
agent_capabilities- For agents (git.commit+git.diff)ai_model- AI integration (gpt-4, claude, gemini)nix_channel- Nix channel (stable-24.05)extensions- IDE extensionslifecycle_hooks- onCreate/onStart/onStop commands
Examples
Simple API
type,name,template,language,packages
service,api,go-http,go-1.22,postgresql-17
AI Agent
type,name,template,language,packages,agent_capabilities,ai_model
agent,git-agent,ai-agent,rust-1.91,none,git.commit+git.diff,gpt-4
Full Stack
type,name,template,language,packages
service,backend,rust-axum,rust-1.91,postgresql-17+redis-7
frontend,web,react-vite,node-20,none
agent,cache,ai-agent,rust-1.91,redis-7
Architecture
Database
- PostgreSQL stores all configurations
- 205+ prebuilt packages cataloged
- Environment templates
- Deployment history
Infrastructure Integration
- AWS EC2: PostgreSQL, Redis, Prometheus
- Cloudflare Workers: RIC (agent coordination)
- Fly.io: Service deployment
- Cloudflare Tunnel: HTTPS exposure
Workflow
manifest.csv
  → perfection generate
  → Configs saved to DB
  → perfection deploy
  → Service on Fly.io/Local
  → Agent registers with RIC
  → Metrics to Prometheus
Development
Project Structure
perfection/
├── cli/                    # Rust CLI
│   ├── src/
│   │   ├── commands/       # generate, deploy, status, etc
│   │   ├── parsers/        # Manifest parser
│   │   ├── generators/     # Config generators
│   │   └── deployers/      # Deployment logic
│   └── Cargo.toml
├── schema/                 # Database schemas
├── examples/               # Example manifests
├── docs/                   # Documentation
└── README.md
Adding Templates
- Add to
schema/002_seed_environments.sql - Create template in
templates/ - Update generators if needed
Adding Platforms
- Create new deployer in
cli/src/deployers/ - Implement
Deployertrait - Add to
DeployerTypeenum
Troubleshooting
Database Connection Failed
# Check PostgreSQL
systemctl status postgresql

# Test connection
psql -h localhost -U postgres -d perfection -c "SELECT 1;"
Deployment Failed
# Check logs
perfection logs api

# Try local first
perfection deploy api --platform local

# Check generated configs
cat generated/api/Dockerfile
Port Already in Use
# Perfection finds next available port automatically
# Or stop existing service
perfection stop api
Cost
Infrastructure:
- AWS EC2: ~$20/month (PostgreSQL, Redis, Prometheus)
- Cloudflare: $0 (Workers, Tunnel)
- Fly.io: $0 (3 free VMs)
Total: ~$20/month
Status
Version: 1.0.0
Status: ✅ Production Ready
Created: December 12, 2025
Features:
- ✅ Manifest parser with validation
- ✅ Config generators (Docker, Fly, Nix)
- ✅ Multi-platform deployment (Local, Fly.io)
- ✅ RIC integration (agent registration)
- ✅ Prometheus monitoring
- ✅ Database-backed configuration
- ✅ Full CLI with 7 commands
Resources
- Main Docs:
perfection/README.md - Installation:
perfection/INSTALL.md - Examples:
perfection/examples/ - Test Script:
perfection/test-perfection.sh
The perfect way to deploy everything. 🚀
Observatory
3D visualization of your entire agent network. Discover by exploring, not by reading.
Philosophy: Ambient Delight
Observatory follows a discovery-based design:
❌ NO instructions, tips, or tutorials
✅ YES to rewards, achievements, and celebration
Like an iPhone: Obvious from design. 3-year-olds figure it out. You will too.
What You’ll Discover
Visual System
- Spheres = Your services/agents
- Lines = Connections between them
- Colors = Status (you’ll learn by watching)
- Movement = System activity
Interactions
- Drag = Rotate view
- Scroll = Zoom
- Click = Discover what happens
- Explore = Find hidden features
Achievements
As you explore, you’ll unlock:
- ✨ First Contact (click your first node)
- 🎯 Explorer (click 5 nodes)
- 💻 Console Cowboy (use terminal)
- 🔍 Big Picture (view overview)
- 🎨 Customizer (change appearance)
- 📁 File Explorer (browse files)
Each achievement comes with celebration - sparkles, confetti, level-ups!
Features You’ll Find
The 3D Space
- Rotate, zoom, explore
- Each sphere is interactive
- Connections show relationships
- Everything updates in real-time
The Bottom Dock
Left side = System tools (you’ll figure them out)
Right side = External tools (IDE, Git, etc)
Hover to see what they do. Click to use them.
Customization
Find the settings. Change:
- Sphere colors
- Connector colors
- Sizes and styles
- Changes apply instantly
Menus
Top bar has dropdown menus. Useful actions inside.
Current Status
Location: neuais.com/hub.neuais.com/observatory.neuais.com/
Access:
cd neuais.com/hub.neuais.com/observatory.neuais.com
python3 -m http.server 3000

# Open: http://localhost:3000
Public: https://observatory.neuais.com (via Cloudflare Tunnel)
Features
Implemented ✅
- 3D node visualization (Three.js)
- Real-time data loading
- Interactive cards (drag, minimize, close)
- Achievement system with rewards
- XP and level progression
- First-run experience (scenario mode)
- Customizable appearance
- Dropdown menus
- Terminal card
- Overview card
- Metrics card
In Progress 🚧
- Real metrics integration (Prometheus)
- Live command execution
- Agent health monitoring
- File browser integration
Technical Details
Stack
- Three.js - 3D rendering
- Vanilla JS - No framework bloat
- CSS Glass - Modern glassmorphic UI
- Local Storage - Save preferences
Data Sources
observatory-data.js- Static test dataobservatory-data-live.js- Future: Real metrics
Architecture
Observatory
├── Core (3D scene)
├── Data (agent info)
├── Visual Config (customization)
├── Cards (information panels)
├── Dock (tool launcher)
├── Achievements (gamification)
└── First Run (initial experience)
Files
observatory.neuais.com/
├── index.html
├── css/
│   ├── observatory-*.css
│   ├── cards-improved.css
│   ├── achievements.css
│   ├── dropdown-menus.css
│   └── first-run.css
└── js/
    ├── observatory-core.js
    ├── observatory-data*.js
    ├── observatory-cards-improved.js
    ├── achievement-system.js
    ├── observatory-first-run.js
    ├── observatory-menu-dropdown.js
    └── observatory-visual-config.js
Integration
With RIC
- Agents appear as nodes
- Status updates in real-time
- Click nodes to see agent details
With GitArena
- Dock button opens Git interface
- Manage repositories
With IDE
- Dock button opens development environment
- Edit code in browser
With Perfection
- Services deployed via Perfection appear automatically
- Status tracked and visualized
Design Principles
From the original vision:
“It kind of needs to be obvious, fun, clear, meaningful from the get go without a tip…. like an iphone. 3 year olds work literally everything n they love it.”
Implementation:
- Self-evident - Design tells you what to do
- Rewarding - Every action gets feedback
- Celebratory - Achievements, not instructions
- Discoverable - Features reveal themselves
- Delightful - Sparkles, confetti, sounds
Customization
Observatory is fully customizable:
Visual Preferences
- Node colors
- Node sizes
- Connector colors
- Connector opacity
- Connector styles
All saved to browser localStorage.
Theme
- Dark background (starfield)
- Glass panels
- White/grey text
- Minimal, professional
Achievements
Track your exploration:
| Achievement | Unlock Condition |
|---|---|
| First Contact | Click first node |
| Explorer | Click 5 nodes |
| Investigator | Click 10 nodes |
| Console Cowboy | Use terminal |
| Big Picture | View overview |
| Metrics Master | View metrics |
| Customizer | Change settings |
| File Explorer | Open file browser |
Each unlocks with celebration!
Development
Running Locally
cd observatory.neuais.com
python3 -m http.server 3000
Making Changes
- Edit files in place
- Refresh browser
- Check browser console for errors
Adding Features
- Create new card type in
card-templates.js - Add UI in
observatory-cards-improved.js - Wire up functionality
- Test!
Troubleshooting
No Nodes Visible
- Check data in
observatory-data.js - Refresh page
- Check browser console
Can’t Click Anything
- Close overlapping cards (click ×)
- Refresh page
- Check for JS errors
Customization Not Saving
- Check localStorage is enabled
- Clear browser cache
- Try different browser
Future
Planned Features
- Real-time metrics from Prometheus
- Command execution via terminal
- File browser integration
- Agent deployment from UI
- Health monitoring
- Log streaming
- Alert notifications
Integration Goals
- Full Perfection integration
- RIC agent management
- GitArena workflows
- IDE code editing
Explore. Discover. Enjoy. 🌌
The interface that teaches itself.
Observatory Visual Customization
Overview
Users can customize how the Observatory displays their system architecture through colors, shapes, and visual preferences.
Features
1. Legend Card
Access: Dock → Legend
Shows complete visual guide:
- Component categories and colors
- Status indicators (active, stopped, starting)
- Connection types and colors
- Shape meanings
Dynamic: Updates based on user customization.
2. Shape Differentiation
Different 3D shapes for different component types:
- ◆ Diamond (octahedron) - Databases (PostgreSQL, Redis)
- ▲ Pyramid (tetrahedron) - Service registries (Consul, Yggdrasil)
- ■ Cube - AI agents (all types)
- ● Sphere - API services (HTTP, gRPC)
- ◯ Torus - Edge services (Cloudflare Workers)
Accessibility: Shape + color helps colorblind users differentiate components.
3. Connection Styling
Particles between nodes are color-coded by connection type:
- Blue - HTTP API calls (medium speed)
- Purple - gRPC high-performance (faster)
- Red - Database queries (slower, larger particles)
- Amber - Cache access (very fast, smaller particles)
- Emerald - Message queue
- Cyan - Service discovery/registry
Connection type is inferred from manifest dependencies or node types.
4. Type-Based Coloring
Each component type has a unique default color:
Infrastructure:
- PostgreSQL: Blue
- Redis: Red
- Consul: Purple
- Yggdrasil: Cyan
Services:
- Auth: Emerald
- Compute: Purple
- Storage: Amber
- SMO: Blue
- RIC: Indigo
Agents:
- RIC-integrated: Green
- Worker: Yellow
- Batch: Purple
- Streaming: Cyan
5. Customization Panel
Access: Dock → Customize
Users can:
- Toggle between “Color by Category” and “Color by Type”
- Pick custom colors for each type (color picker)
- Choose shapes for each type (dropdown)
- Preview changes in real-time
- Save preferences
- Reset to defaults
6. Persistent Configuration
Storage: localStorage Persistence: Survives browser restarts Scope: Per-user, per-browser
Users’ visual preferences are automatically saved and restored on next visit.
User Workflow
Viewing the Legend
- Hover bottom of screen
- Dock appears
- Click “Legend” icon
- Floating card shows complete visual guide
Customizing Visuals
- Hover bottom of screen
- Click “Customize” in dock
- Choose mode (by Category or by Type)
- Adjust colors and shapes for each type
- Click “Save & Apply”
- Visualization rebuilds with new scheme
Resetting to Defaults
- Open Customize panel
- Click “Reset to Default”
- Confirm prompt
- Visualization returns to original scheme
Technical Architecture
Configuration Object
{
  mode: 'type',  // 'type' or 'category'
  types: {
    'postgres': {
      color: '#3b82f6',
      shape: 'octahedron',
      label: 'PostgreSQL'
    }
  },
  categories: {
    'infrastructure': {
      color: '#ef4444',
      shape: 'octahedron'
    }
  }
}
Files
Core Logic:
js/observatory-visual-config.js- Configuration management
UI Components:
js/observatory-cards.js- Legend and customize cardsjs/observatory-dock.js- Dock items for legend and customize
Rendering:
index-live.html- Node creation with shapes/colorscss/observatory-cards.css- Legend and customize styles
Integration Points
Node Creation:
- Queries
observatoryVisualConfigfor color/shape - Falls back to built-in TYPE_COLORS and SHAPE_MAP
Particle Creation:
- Uses CONNECTION_STYLES for particle appearance
- Based on inferred connection type
Legend Generation:
- Dynamically generated from current config
- Shows actual colors/shapes in use
Default Visual Scheme
Node Colors (Type Mode)
Infrastructure:
- PostgreSQL: #3b82f6 (Blue)
- Redis: #ef4444 (Red)
- Consul: #8b5cf6 (Purple)
Services:
- Auth: #10b981 (Emerald)
- SMO: #3b82f6 (Blue)
- RIC: #6366f1 (Indigo)
Agents:
- RIC-integrated: #22c55e (Green)
- Worker: #facc15 (Yellow)
- Batch: #a855f7 (Purple)
Node Shapes
Infrastructure:
- Databases: Octahedron (diamond)
- Registries: Tetrahedron (pyramid)
Services:
- HTTP/gRPC: Sphere
- Edge: Torus
Agents:
- All types: Cube
Connection Colors
- HTTP: #3b82f6 (Blue)
- gRPC: #8b5cf6 (Purple)
- Database: #ef4444 (Red)
- Cache: #f59e0b (Amber)
- Queue: #10b981 (Emerald)
- Registry: #06b6d4 (Cyan)
Status Indicators
- Active: Bright, glowing, full opacity
- Stopped/Idle: Grey (#666666), dim, 60% opacity
- Starting: Pulsing yellow animation
Performance
Shape Complexity (Vertices)
- Tetrahedron: ~12 vertices (lightest)
- Octahedron: ~24 vertices (light)
- Cube: ~24 vertices (light)
- Sphere (16 segments): ~289 vertices (medium)
- Torus: ~512+ vertices (heavy)
Recommendation: Use torus sparingly for special nodes only.
Optimization Strategies
For large systems (100+ nodes):
- Reduce sphere segments to 8-16
- Use InstancedMesh for nodes with same shape+color
- Implement LOD (Level of Detail) for distant nodes
- Limit particle count per connection
Future Enhancements
Preset Themes
- Database-focus (highlight databases, dim others)
- AI-focus (highlight agents, dim services)
- Colorblind-safe (high contrast, distinct shapes)
Export/Import
- Export config as JSON
- Share with team
- Version control for visual layouts
Advanced Filtering
- Click legend item → Highlight matching nodes
- Search by type → Auto-highlight
- Hide categories temporarily
Mini Preview
- Live 3D preview in customization panel
- See changes before applying
- A/B comparison mode
Troubleshooting
Colors not changing:
- Check browser console for errors
- Verify localStorage is enabled
- Try “Reset to Default” then re-customize
Shapes not rendering:
- Some shapes (torus) are GPU-intensive
- Reduce complexity for older hardware
- Check Three.js console warnings
Settings not persisting:
- Check localStorage quota
- Clear old data:
localStorage.clear() - Try different browser
Performance issues:
- Reduce torus usage (heavy geometry)
- Lower sphere segment count
- Disable particle flows temporarily (Filters card)
API Integration
WebSocket Command (future):
ws.send({
  type: 'update_visual_config',
  config: visualConfig
});
Team Sync (future):
- Save config to backend
- Sync across team members
- Organization-wide defaults
Observatory + Agent Integration
The NeuAIs Observatory provides 3D visualization of all agents, services, and infrastructure generated from the manifest system.
Architecture
CSV Manifest → Perfection Generator → generated.manifest.json
                                            ↓
                                    Observatory API (3003)
                                            ↓
                                    WebSocket (3004)
                                            ↓
                                    3D Visualization
Components
1. Observatory API Server
Location: observatory.neuais.com/api/server.js
Port: 3003 (HTTP), 3004 (WebSocket)
Purpose:
- Reads
generated.manifest.jsonfrom Perfection system - Transforms manifest data into Observatory-compatible format
- Serves REST API endpoints
- Broadcasts real-time updates via WebSocket
Endpoints:
GET  /api/manifest          - Full system data
GET  /api/agents            - All agents
GET  /api/agents/:id        - Specific agent details
GET  /api/services          - All services
GET  /api/infrastructure    - All infrastructure
GET  /health                - API health check
2. Live Data Client
Location: observatory.neuais.com/js/observatory-data-live.js
Purpose:
- Connects to Observatory API
- Establishes WebSocket for real-time updates
- Handles reconnection logic
- Exposes agent control methods (start/stop)
Usage:
const client = new ObservatoryDataClient();
await client.connect();

// Listen for updates
client.on('data_update', (data) => {
    // Refresh visualization
});

client.on('agent_status', (update) => {
    // Update specific agent
});

// Control agents
client.startAgent('anomaly-detector');
client.stopAgent('code-reviewer');
3. Live Visualization
Location: observatory.neuais.com/index-live.html
Features:
- Loads data from API instead of hardcoded file
- Updates visualization when manifest changes
- Shows connection status indicator
- Real-time particle flows between connected nodes
- Interactive node selection
Data Flow
Initial Load
- User opens
http://localhost:3003/index-live.html observatory-data-live.jsconnects to API- API reads latest
generated.manifest.json - Data transformed to Observatory format
- 3D nodes created for each agent/service/infrastructure
- Particle flows created based on dependencies
Real-time Updates
- Perfection generates new manifest
- Observatory API detects file change
- API broadcasts update via WebSocket
- All connected clients receive update
- Visualization rebuilds with new data
- Stats counters update
User Interactions
- User clicks 3D node
- Detail card appears with agent info
- User clicks “Start” button
- WebSocket sends
start_agentcommand - API forwards to agent runtime (future)
- Status updates via WebSocket
- Node visual updates (color, pulse)
Data Format
Manifest Format (Perfection)
{
  "agents": [{
    "name": "anomaly-detector",
    "language": "rust",
    "template": "ric-integrated-agent",
    "lm_provider": "openai",
    "lm_model": "gpt-4",
    "dependencies": [
      {"type": "service", "name": "ric"},
      {"type": "service", "name": "smo"}
    ]
  }]
}
Observatory Format (Transformed)
{
  "agents": [{
    "id": "anomaly-detector",
    "name": "Anomaly Detector",
    "status": "active",
    "cpu": 12,
    "mem": "24MB",
    "connections": ["ric", "smo"],
    "metadata": {
      "language": "rust",
      "template": "ric-integrated-agent",
      "lm_provider": "openai",
      "lm_model": "gpt-4"
    }
  }]
}
Visual Design
Color Scheme (NeuAIs Brand)
- Agents: White (#FFFFFF) to light grey (#CCCCCC)
- Services: Medium grey (#666666) to grey (#999999)
- Infrastructure: Dark grey (#1a1a1a) to dark grey (#333333)
- Particles: Match source node color
- Background: Pure black (#000000)
Node Sizes
- Infrastructure: 0.8 units (largest)
- Services: 0.5 units (medium)
- Agents: 0.4 units (smallest)
Animations
- Pulse: Nodes breathe (scale 0.85-1.0)
- Glow: Emissive intensity oscillates
- Particles: Flow along bezier curves between nodes
- Rotation: Auto-rotate entire system (optional)
Scaling to 1000 Agents
Performance Optimizations
Current: 30 nodes (9 agents + 19 services + 3 infra)
Target: 1000+ agents
Strategies:
-
Level of Detail (LOD)
- Distant nodes: Simple spheres
- Close nodes: Detailed geometry with labels
-
Frustum Culling
- Only render nodes in camera view
- Improves performance by 40-60%
-
Instancing
- Reuse geometry for similar nodes
- Reduces draw calls from 1000 to ~10
-
Particle Pooling
- Reuse particle objects
- Limit max particles to 5000
-
Update Throttling
- Update positions at 60 FPS
- Update metrics at 1 FPS
- Reduces CPU usage by 70%
Integration with Control Panel
Both interfaces work together:
Control Panel (port 3002):
- List view of all components
- Table-based management
- Detail panels
- Start/stop buttons
Observatory (port 3003):
- 3D spatial view
- Visual connections
- System architecture
- Real-time flows
Users can use either or both depending on preference.
Usage
Start Observatory
cd neuais.com/hub.neuais.com/observatory.neuais.com
./start-observatory.sh
Opens at: http://localhost:3003/index-live.html
Generate New System
cd neuais.com/automation
./cli/perfection generate manifest/neuais-complete.csv
Observatory automatically updates when manifest changes.
Monitor Live
- Open Observatory in browser
- Watch connection status indicator (top-right)
- Green = Connected and receiving updates
- Grey = Disconnected or loading
Future Enhancements
-
Real SMO/RIC Status
- Poll actual agent health from SMO
- Show real CPU/memory from metrics endpoints
-
Interactive Controls
- Right-click node → Start/Stop/Restart
- Drag between nodes → Create connection
- Double-click → Open in IDE
-
Advanced Filtering
- Search agents by name
- Filter by language, status, LM provider
- Group by capability or policy
-
Workflow Visualization
- Show task flows as animated particles
- Click particle to see task details
- Trace task path through system
Testing
# Terminal 1: Generate system
cd neuais.com/automation
./cli/perfection generate manifest/neuais-complete.csv

# Terminal 2: Start API
cd observatory.neuais.com
./start-observatory.sh

# Terminal 3: Check API
curl http://localhost:3003/api/agents | jq
curl http://localhost:3003/api/manifest | jq '.agents | length'

# Browser: Open Observatory
open http://localhost:3003/index-live.html
Expected result:
- See all 9 agents as white/grey nodes
- See all 19 services as medium grey nodes
- See 3 infrastructure components as dark grey nodes
- Particles flowing between connected nodes
- Stats showing 9/19/3 counts
Known Limitations
- Status is simulated - Not yet querying real agent processes
- Metrics are estimated - CPU/memory values are placeholders
- Start/Stop is stubbed - Sends WebSocket message but doesn’t actually start agents
- No filtering yet - Shows all nodes always
These will be addressed when real agent runtime is implemented.
The integration architecture is complete and ready. The 3D visualization now pulls live data from your manifest system.
Agent–SMO/RIC Integration
A stable, long-term pattern for generated agents within the NeuAIs platform.
Overview
Our orchestration model has followed the same shape since early platform development: SMO (System Management & Orchestration) coordinates agent lifecycle and event routing, and RIC (Resource Information Coordinator) provides shared ML inference and metrics services.
All production rApps have used this pattern for several years. Generated agents now adopt these same conventions. This brings the scaffolding layer into alignment with the existing runtime model and removes the need for manual wiring during prototyping and early development.
The goal of this work is not to introduce a new capability, but to ensure that every generated agent behaves consistently with the agents already operating in the core platform.
Platform Context
Inside NeuAIs, agents are designed as independent, routable functions that rely on the platform rather than bespoke glue code. Standardisation around SMO and RIC has ensured:
- predictable lifecycle management
- consistent health/status interfaces
- a uniform event contract
- access to shared ML capabilities
- compatibility with our deployment and observability tooling
By updating the generator templates, newly created agents now inherit the same stability and operational guarantees as long-running rApps.
Behavioural Contract for Generated Agents
All generated agents—regardless of language or workload type—conform to the platform’s established rApp interface:
1. Startup Registration
On boot, an agent registers with SMO. Registration includes metadata, capability name, and expected event types. This is the same handshake used by all production agents.
2. Standard Endpoints
The agent exposes a small, stable HTTP interface:
/health— readiness/liveness/status— internal state summary/metadata— static capability + config/event— event processing entry point
These endpoints mirror the existing rApp contract.
3. RIC Client Integration
Agents can call RIC for ML inference or metrics updates. The integration is minimal and follows the platform’s standard client behaviour.
4. Lifecycle Hooks
Every agent implements initialise/start/stop behaviours that SMO can rely on for orchestration and graceful shutdown.
Template Implementation
The generator produces templates that include the platform contract:
Rust-based Agents
- Implement the
Agenttrait from the internal agent framework - Adapted to rApp conventions via the
AgentRAppAdapter - Expose standard endpoints through Axum
- Include a lightweight RIC HTTP client
Go-based Agents
- Extend the
BaseRApptype from the ai-network module - Provide the standard lifecycle functions
- Include idiomatic RIC and SMO clients
- Provide the same endpoint surface as the Rust agents
Although implementation differs per language, the contract is uniform and stable.
Configuration
Generated agents use the same environment variables as production agents:
| Variable | Purpose |
|---|---|
RIC_URL | Location of the shared ML/metrics service |
SMO_URL | Orchestration and lifecycle management endpoint |
PORT | HTTP port for rApp endpoints (auto-assigned during generation) |
RUST_LOG / logging vars | Standardised logging configuration |
| LM provider fields | Optional for agents that require text-based inference |
These defaults remain consistent across environments to simplify deployment and local development.
Operational Model
With this integration, generated agents immediately participate in the standard runtime flow:
SMO → Agent → RIC → Agent → SMO
- SMO discovers and manages agents
- Agents process events through
/event - RIC provides inference/metrics when requested
- SMO uses responses to continue orchestration
No custom integration or manual wiring is required.
Deployment Pattern
Generated agents follow the same containerisation and deployment pattern as all platform services:
- multi-stage Dockerfiles for small images
- environment-driven configuration
- compatibility with Docker Compose and Kubernetes
- identical logging and health-check behaviour
This ensures any environment that can run a production rApp can also run a newly generated agent.
Verification Practices
The generator emits agents that should compile and run immediately within their language toolchain. Teams integrating new agents can rely on these checks:
- Registration: confirm SMO logs show the agent handshake
- Health: verify
/healthand/metadatareturn expected structures - Event Flow: send a test event and confirm RIC calls occur when required
- Deployment: container should build and run with platform defaults
These checks reflect the same verification steps used for long-standing agents.
Known Considerations
Some generated agents may require version alignment with the platform-pinned toolchains (e.g., Rust crate versions). These cases are environmental rather than architectural and do not affect the underlying rApp contract.
Summary
Bringing the generator templates in line with the established SMO/RIC model ensures that:
- developers work with a consistent mental model
- generated agents behave identically to mature rApps
- no bespoke integration is needed during early development
- platform behaviour is uniform across all languages and workloads
This update strengthens the continuity of the NeuAIs platform and reinforces the reliability of agent behaviour across environments.
Model Inventory
Quick Reference
| Model Name | Type | Size | Purpose | Location |
|---|---|---|---|---|
| Image Models | Various | 149GB | Image generation, vision | models/image-models/ |
| Text Models | LLMs | 122GB | Text generation, NLP | models/text-models/ |
| Local Learning | 120B | TBD | 24/7 learning system | training/local-learning-system/ |
Image Models (149GB)
Source: ComfyUI installation
Location: models/image-models/ → /home/adminator/comfy/ComfyUI/image-models
Used by:
- Vision agents
- Image generation agents
- Image analysis agents
Note: Symlinked to avoid duplication. Do NOT delete source!
Text Models (122GB)
Source: Llama.cpp installation
Location: models/text-models/ → /home/adminator/llama.cpp/text-models
Used by:
- NLP agents
- Text generation agents
- Sentiment analyzers
- Intent classifiers
Note: Symlinked to avoid duplication. Do NOT delete source!
Local Learning System
Location: training/local-learning-system/
From expert_agents/LOCAL_MODEL_AGENT.md:
- 24/7 learning capability
- Knowledge accumulation
- Offline inference
- Custom domain learning
Integration: Connect this to SMO for continuous learning
Specialized Systems
Vision System
Computer vision components and pipelines.
Arthur
Specialized ML system (investigate purpose).
Model Armour
Security and validation tools for models.
Creating Agent Models
Micro-agents need small, fast models:
- Start with large model (from text-models/)
- Fine-tune on specific task
- Quantize (FP32 → INT8)
- Optimize for latency
- Store in
models/agent-models/
Target specs:
- Size: <500MB
- Latency: <100ms
- Accuracy: >90%
Next Steps
- Catalog all models in image-models/
- Catalog all models in text-models/
- Create agent-specific models
- Set up MLflow registry
- Build training pipeline
Development Tools Branding
Aligning external tools with the NeuAIs platform identity.
Context
The platform relies on self-hosted development tools rather than external services. Two tools—GitArena (Git platform) and Lapdev (web IDE)—have been integrated into the codebase and rebranded to match the NeuAIs identity.
This document describes the branding approach and integration pattern.
Brand Requirements
From the established brand guidelines (mgmt/brand/BRAND_QUICK.md):
- Name: NeuAIs (strict spelling)
- Colors: Black (#000000), White (#FFFFFF), Greys (#1a1a1a, #666666, #cccccc)
- No gradients
- No emojis
- Dark theme default
- Direct, minimal, technical tone
Tools Overview
NeuAIs Git (GitArena)
Location: neuais.com/tools/git/gitarena/
Language: Rust (Axum web framework)
Port: 3000
Self-hosted Git platform with repository management, issue tracking, and code review.
Branding Applied:
- Logo replaced with NeuAIs mark (black lightning bolt)
- Site title: “NeuAIs Git”
- Custom CSS (
neuais-brand.css) enforcing black/white/grey palette - Dark theme default
- Navigation updated
NeuAIs IDE (Lapdev)
Location: neuais.com/tools/ide/lapdev-lapdev-cli/
Language: Rust (Leptos UI)
Port: 3001
Full web-based IDE with terminal, LSP, extensions, and Kubernetes integration.
Branding Applied:
- README rebranded
- Configuration defaults updated
- Instance name: “NeuAIs IDE”
Integration with Manifest
Both tools are defined in the manifest CSV as tool type entries:
type,name,description,template,language,port
tool,git,NeuAIs Git server,gitarena,rust,3000
tool,ide,NeuAIs IDE server,lapdev,rust,3001
When the manifest is processed, a generator (automation/generators/generate-tools.js) produces configuration files:
generated/tools/git/config.env- GitArena configurationgenerated/tools/ide/config.env- Lapdev configuration
These configs follow the same environment-driven pattern as all platform services.
Deployment
Both tools use the platform’s standard deployment pattern:
Build:
# GitArena
cd tools/git/gitarena
cargo build --release

# Lapdev
cd tools/ide/lapdev-lapdev-cli
cargo build --release -p lapdev-ws
Run:
# From automation directory
./run-gitarena.sh   # Port 3000
./run-lapdev.sh     # Port 3001
Run scripts load generated configs and start services with correct environment variables.
Configuration Pattern
Generated configs include:
# NeuAIs Git
BIND_ADDRESS=0.0.0.0:3000
DATABASE_URL=postgresql://localhost/neuais
INSTANCE_NAME=NeuAIs Git
THEME=dark
# NeuAIs IDE
LAPDEV_WS_PORT=3001
LAPDEV_HOST=0.0.0.0
DATABASE_URL=postgresql://localhost/neuais
LAPDEV_INSTANCE_NAME=NeuAIs IDE
LAPDEV_THEME=dark
Same pattern as services and agents: environment variables, predictable ports, Postgres dependency.
Branding Assets
Logo: neuais.com/public-shared/assets/svgs/brand/logo-black.svg
Three variants created for GitArena:
logo.svg- Base logologo_text.svg- Logo + “NeuAIs” textlogo_border.svg- Logo in bordered box
CSS variables enforce color palette:
:root {
  --neuais-black: #000000;
  --neuais-dark-grey: #1a1a1a;
  --neuais-grey: #666666;
  --neuais-light-grey: #cccccc;
  --neuais-white: #FFFFFF;
}
Summary
Development tools follow the same integration pattern as platform services:
- Defined in manifest
- Configuration generated automatically
- Standard deployment pattern
- Consistent branding
- Environment-driven config
This ensures tools behave like first-class platform components rather than external add-ons.
Location: docs-internal/integration/
Related: Agent integration patterns (smo-ric-agent-integration.md)
NeuAIS Management Operations Plan: Marketing & Dev Teams
Date: December 5, 2025
Purpose: Operational structure for Marketing & Dev teams aligned with Platform Overhaul
Goal: Scale to 1000 agents, enterprise sales, and efficient operations
Executive Summary
The /mgmt directory currently has strong brand strategy and personas but lacks operational structure for marketing and dev teams to execute efficiently.
Proposal: Reorganize /mgmt into clear workflows, standardized processes, and automation-first operations that demonstrate our value proposition: eliminate toil.
Current State Analysis
What Exists ✅
- ✅ BRAND_STRATEGY.md - Excellent positioning (“minutes truth”)
- ✅ ENTERPRISE_PERSONAS.md - 5 detailed personas (CTO, CFO, VP Eng, CISO, Board)
- ✅ OPERATIONS_PLAN.md - Meeting frameworks, CRM structure, metrics
- ✅ EXECUTIVE_MESSAGING.md - Persona-specific messaging
- ⚠️ MARKETING_PLAN.md - Outdated (CloudNix focused, not neuais)
What’s Missing ❌
- ❌ Sales playbooks -
/mgmt/sales/is empty - ❌ Marketing calendar - No content schedule
- ❌ Team operations -
/mgmt/team-ops/is empty - ❌ Dev team processes - No engineering playbook
- ❌ CRM structure -
/mgmt/crm/is empty - ❌ Customer tracking - No customer folders
Proposed Structure: /mgmt Reorganization
/mgmt/
├── README.md                          # Overview & navigation
├── TEAM_HANDBOOK.md                   # Combined team guide
│
├── brand/                             # Brand assets & strategy
│   ├── BRAND_STRATEGY.md             # ✅ Keep (excellent)
│   ├── ENTERPRISE_PERSONAS.md        # ✅ Keep (excellent)
│   ├── EXECUTIVE_MESSAGING.md        # ✅ Keep (excellent)
│   ├── brand-kit/
│   │   ├── BRAND_VOICE.md            # ✅ Keep
│   │   ├── logos/                    # Brand assets
│   │   ├── colors/                   # Color palette
│   │   └── templates/                # Pitch decks, one-pagers
│   └── messaging/                    # Persona-specific messaging
│       ├── cto-pitch.md
│       ├── cfo-pitch.md
│       ├── vp-eng-pitch.md
│       ├── ciso-pitch.md
│       └── board-pitch.md
│
├── marketing/                        # Marketing operations
│   ├── MARKETING_STRATEGY.md        # ⚠️ Update (neuais focus)
│   ├── CONTENT_CALENDAR.md          # NEW - Editorial calendar
│   ├── campaigns/                    # Campaign tracking
│   │   ├── 2025-q4-launch/
│   │   ├── 2026-q1-enterprise/
│   │   └── README.md
│   ├── content/                      # Content production
│   │   ├── blog/
│   │   ├── case-studies/
│   │   ├── whitepapers/
│   │   └── videos/
│   ├── analytics/                    # Performance tracking
│   │   ├── weekly-metrics.md
│   │   └── dashboard-config.yaml
│   └── tools/                        # Marketing tools & scripts
│       └── automation/
│
├── sales/                            # Sales operations
│   ├── SALES_PLAYBOOK.md            # NEW - Complete sales guide
│   ├── DEMO_SCRIPT.md               # NEW - Demo walkthrough
│   ├── OBJECTION_HANDLING.md        # NEW - Objections & responses
│   ├── PRICING.md                   # NEW - Pricing strategy
│   ├── demos/                        # Demo recordings & notes
│   │   └── COMPANY-DATE.md
│   ├── playbooks/                    # Persona-specific playbooks
│   │   ├── cto-playbook.md
│   │   ├── cfo-playbook.md
│   │   └── vp-eng-playbook.md
│   └── templates/                    # Email templates, proposals
│       ├── initial-outreach.md
│       ├── demo-followup.md
│       ├── pilot-proposal.md
│       └── contract-template.md
│
├── customers/                        # Customer tracking
│   ├── README.md                    # Customer folder guide
│   ├── COMPANY-A/
│   │   ├── overview.md              # Company info
│   │   ├── discovery-notes.md       # Initial conversations
│   │   ├── demo-YYYY-MM-DD.md      # Demo notes
│   │   ├── pilot/                   # Pilot program
│   │   │   ├── kickoff.md
│   │   │   ├── week-1-report.md
│   │   │   ├── week-2-report.md
│   │   │   ├── week-3-report.md
│   │   │   └── week-4-results.md
│   │   ├── contract.md              # Contract terms
│   │   └── ongoing/                 # Post-sale notes
│   └── TEMPLATE/                    # Template for new customers
│
├── dev-team/                        # Engineering operations
│   ├── ENGINEERING_HANDBOOK.md     # NEW - Dev processes
│   ├── ONBOARDING.md               # NEW - New engineer guide
│   ├── ARCHITECTURE_DECISIONS.md   # NEW - ADR log
│   ├── sprint-planning/             # Sprint docs
│   │   ├── 2025-w49/
│   │   └── README.md
│   ├── code-review/                 # Review guidelines
│   │   ├── GUIDELINES.md
│   │   └── CHECKLIST.md
│   ├── deployment/                  # Deployment docs
│   │   ├── RUNBOOK.md
│   │   └── ROLLBACK.md
│   └── incidents/                   # Incident postmortems
│       └── TEMPLATE.md
│
├── operations/                      # Business operations
│   ├── OPERATIONS_PLAN.md          # ✅ Keep (excellent)
│   ├── meetings/                    # Meeting notes
│   │   ├── weekly/
│   │   │   └── YYYY-MM-DD.md
│   │   ├── monthly-retro/
│   │   │   └── YYYY-MM.md
│   │   └── MEETING_GUIDELINES.md
│   ├── metrics/                     # Business metrics
│   │   ├── weekly-dashboard.md
│   │   ├── okrs/
│   │   └── targets.yaml
│   └── processes/                   # Standard processes
│       ├── hiring.md
│       ├── vendor-management.md
│       └── budget-planning.md
│
└── archive/                         # Old/deprecated docs
    ├── DOCS_OVERHAUL_STATUS.md     # Move here (outdated)
    ├── WEEK1_PROGRESS.md           # Move here (outdated)
    └── TEAM_BRIEFING.md            # Move here (outdated)
Marketing Team Operations
Team Structure
Current (Phase 1: Months 1-3)
- Marketing Lead (Founder role)
- Content Creator (Contractor, 20h/week)
- Designer (Contractor, 10h/week)
Growth (Phase 2: Months 4-6)
- Marketing Lead (Full-time)
- Content Marketing Manager (Full-time hire)
- Growth Marketer (Full-time hire)
- Designer (Contractor → Full-time)
Weekly Marketing Workflow
Monday: Planning
9:00 AM - Team standup (15 min, async)
- What shipped last week
- What ships this week
- Blockers
10:00 AM - Content planning (30 min)
- Review content calendar
- Assign pieces for the week
- Update campaign status
Actions:
- Update
CONTENT_CALENDAR.md - Assign content pieces in Linear
- Review analytics from last week
Tuesday-Thursday: Execution
Content Production Days
Daily routine:
- 9:00-12:00: Deep work (writing, design, video)
- 12:00-1:00: Review & feedback
- 1:00-5:00: Distribution & engagement
Outputs per week:
- 2 blog posts (1 technical, 1 thought leadership)
- 5 social posts (LinkedIn + Twitter)
- 1 newsletter
- 1 case study/video (monthly)
Friday: Analysis & Iteration
9:00 AM - Metrics review (30 min)
- Website traffic
- Demo requests
- Content performance
- Campaign ROI
10:00 AM - Next week prep (30 min)
- Schedule social posts
- Queue newsletter
- Prep campaign assets
Actions:
- Update
weekly-metrics.md - Schedule next week’s content
- Flag underperforming campaigns
Content Calendar (Rolling 4-Week View)
File: /mgmt/marketing/CONTENT_CALENDAR.md
# Content Calendar - Q4 2025

## Week of Dec 9-15, 2025

### Blog Posts
- [ ] **Mon Dec 9**: "The Minutes Truth: What Your Team Actually Spends Time On"
  - Author: [Name]
  - Target: CTOs
  - CTA: Book demo
  - Distribution: LinkedIn, Twitter, Newsletter

- [ ] **Thu Dec 12**: "How 3 AI Agents Reduced Our Ops Costs by 71%"
  - Author: [Name]
  - Target: CFOs
  - CTA: ROI calculator
  - Distribution: LinkedIn, Hacker News, Newsletter

### Social Posts
- [ ] **Tue Dec 10**: LinkedIn - Share blog post with CTO messaging
- [ ] **Wed Dec 11**: Twitter - Thread on operational toil statistics
- [ ] **Thu Dec 12**: LinkedIn - Case study teaser
- [ ] **Fri Dec 13**: Twitter - Observatory 3D visualization demo GIF
- [ ] **Sat Dec 14**: LinkedIn - Weekend insight on minutes truth

### Other
- [ ] **Wed Dec 11**: Newsletter - "Weekly ops insights + blog roundup"
- [ ] **Fri Dec 13**: Record demo video for CTO persona

## Week of Dec 16-22, 2025
[Similar structure...]

## Performance Tracking
| Week | Blog Views | Demo Requests | Newsletter Opens |
|------|-----------|---------------|------------------|
| Dec 2-8 | 1,200 | 8 | 34% |
| Dec 9-15 | [TBD] | [TBD] | [TBD] |
Campaign Framework
File: /mgmt/marketing/campaigns/CAMPAIGN_TEMPLATE.md
# Campaign Name

**Duration**: [Start] - [End]
**Goal**: [Specific measurable goal]
**Budget**: $[X]
**Owner**: [Name]

## Target Audience
- Primary: [Persona]
- Channels: [LinkedIn, Twitter, etc.]
- Expected reach: [X people]

## Assets Needed
- [ ] Landing page
- [ ] Email sequence (3 emails)
- [ ] Social creative (5 posts)
- [ ] Blog post
- [ ] Case study

## Distribution Schedule
| Date | Asset | Channel | Owner |
|------|-------|---------|-------|
| [Date] | Email 1 | Newsletter | [Name] |
| [Date] | Post 1 | LinkedIn | [Name] |

## Success Metrics
- Target: [X demo requests]
- Actual: [Y]
- ROI: $[cost per demo request]

## Learnings
[What worked, what didn't]
Dev Team Operations
Team Structure
Current (Phase 1: Months 1-3)
- Tech Lead (Founder)
- Full-Stack Engineer 1 (Full-time)
- Full-Stack Engineer 2 (Full-time)
Growth (Phase 2: Months 4-6)
- Tech Lead (Founder)
- Backend Team (2 engineers)
- Focus: Services, API, agent runtime
- Frontend Team (2 engineers)
- Focus: Dashboard, admin, docs site
- DevOps Engineer (1 engineer)
- Focus: CI/CD, observability, scaling
Weekly Dev Workflow
Monday: Planning & Architecture
9:00 AM - Standup (15 min, async)
## [Engineer Name] - Week of [Date]

### Last Week Shipped
- [Feature X] - deployed to prod
- [Bug fix Y] - resolved

### This Week Plan
- [ ] [Feature A] - backend API
- [ ] [Feature B] - frontend UI
- [ ] [Refactor C] - improve performance

### Blockers
- Waiting on [X] from [person]
- Need design for [Y]
10:00 AM - Sprint planning (30 min)
- Review backlog
- Assign tickets
- Clarify requirements
- Update roadmap
Tuesday-Thursday: Execution & Code Review
Daily routine:
- 9:00-12:00: Deep work (feature development)
- 12:00-1:00: Code review (review others’ PRs)
- 1:00-4:00: Deep work (continued)
- 4:00-5:00: Testing & documentation
Code Review SLA:
- Small PRs (<200 lines): 2 hours
- Medium PRs (<500 lines): 4 hours
- Large PRs (>500 lines): 1 business day
Friday: Testing, Cleanup & Learning
9:00-11:00: Testing
- Integration tests
- E2E tests
- Performance testing
11:00-12:00: Code cleanup
- Fix clippy warnings
- Update documentation
- Refactor technical debt
1:00-3:00: Learning time
- Read RFCs/ADRs
- Experiment with new tools
- Contribute to open source
- Write blog posts
3:00-4:00: Week wrap-up
- Update sprint board
- Document decisions
- Plan next week
Engineering Processes
Pull Request Template
File: /mgmt/dev-team/code-review/PR_TEMPLATE.md
## Description
[What does this PR do?]

## Type of Change
- [ ] Bug fix
- [ ] New feature
- [ ] Refactoring
- [ ] Documentation
- [ ] Performance improvement

## Testing
- [ ] Unit tests added/updated
- [ ] Integration tests added/updated
- [ ] Manual testing completed
- [ ] Performance tested (if applicable)

## Checklist
- [ ] Code follows style guide
- [ ] Self-reviewed the code
- [ ] Added/updated documentation
- [ ] No clippy warnings
- [ ] Tests pass locally
- [ ] Ready for review

## Screenshots (if UI change)
[Add screenshots]

## Performance Impact
[Any performance considerations?]

## Deployment Notes
[Any special deployment steps?]
Architecture Decision Record (ADR) Template
File: /mgmt/dev-team/ARCHITECTURE_DECISIONS.md
# Architecture Decisions Log

## ADR-001: Split state.rs into Modular Components
**Date**: 2025-12-05
**Status**: Implemented ✅
**Context**: state.rs was 918 lines, hard to maintain and test
**Decision**: Extract GraphicsContext, CameraControls into separate modules
**Consequences**:
- ✅ Better testability
- ✅ Clearer separation of concerns
- ⚠️ More files to navigate
**Result**: 13% code reduction, improved maintainability

---

## ADR-002: [Next Decision]
...
Sprint Planning Template
File: /mgmt/dev-team/sprint-planning/YYYY-WXX/sprint-plan.md
# Sprint W49 (Dec 2-8, 2025)

## Sprint Goal
Complete Observatory refactoring and begin Phase 3 data integration

## Team Capacity
- Engineer 1: 40 hours
- Engineer 2: 40 hours
- Tech Lead: 20 hours (50% on architecture)
**Total**: 100 engineering hours

## Committed Work

### High Priority (Must Ship)
- [ ] **[OBS-101]** Extract GraphicsContext module (8h) - @engineer1
- [ ] **[OBS-102]** Add CameraControls tests (4h) - @engineer2
- [ ] **[BACKEND-201]** Consolidate auth services (16h) - @techlead

### Medium Priority (Should Ship)
- [ ] **[DOCS-301]** Update docs.neuais.com structure (12h) - @engineer2
- [ ] **[OBS-103]** Fix clippy warnings (4h) - @engineer1

### Low Priority (Nice to Have)
- [ ] **[OBS-104]** Performance profiling (8h) - @engineer1

## Stretch Goals
- [ ] Begin WebSocket integration
- [ ] Add integration tests

## Risks
- Auth service migration might block dashboard dev
- Graphics refactoring might uncover bugs

## Retrospective (End of Sprint)
[What shipped, what didn't, why]
Team Collaboration Model
Marketing ↔ Dev Collaboration Points
| Activity | Marketing Role | Dev Role | Cadence |
|---|---|---|---|
| Product launches | Campaign, messaging | Feature delivery, docs | Monthly |
| Blog posts (technical) | Editing, distribution | Writing, examples | Weekly |
| Demo environment | Scheduling demos | Maintaining demo instance | Ongoing |
| Case studies | Customer interviews | Metrics extraction | Monthly |
| Documentation | Structure, clarity | Technical accuracy | Ongoing |
| Website updates | Content, design | Implementation | Bi-weekly |
Integration Point: /mgmt/operations/marketing-dev-sync.md
# Marketing ↔ Dev Sync - [Date]

## Upcoming Launches
- [Feature X] - Ready: [Date] - Marketing needs: [Assets]

## Content Needs
- [Blog post Y] - Dev to provide: [Code examples, metrics]

## Demo Status
- Demo environment: [Status]
- Known issues: [List]

## Actions
- [ ] Dev: Fix demo bug by [date]
- [ ] Marketing: Create launch assets by [date]
Automation Strategy (“Practice What We Preach”)
Phase 1: Manual Baseline (Month 1)
Establish processes, measure time spent
| Task | Time/Week | Owner |
|---|---|---|
| Content creation | 20h | Marketing |
| Social media posting | 5h | Marketing |
| Code review | 10h | Dev team |
| Demo scheduling | 2h | Sales |
| Meeting notes | 2h | All |
| Metrics reporting | 3h | All |
| Total: 42 hours/week of operational work |
Phase 2: Semi-Automated (Months 2-3)
Automate repetitive tasks
| Task | Tool | Time Saved |
|---|---|---|
| Social media posting | Buffer/Hootsuite | 3h/week |
| Meeting notes | Otter.ai | 1.5h/week |
| Code review reminders | GitHub Actions | 1h/week |
| Demo scheduling | Calendly | 1.5h/week |
| Metrics dashboards | Grafana/Metabase | 2h/week |
| Total Savings: 9 hours/week (21% reduction) |
Phase 3: Fully Automated (Months 4-6)
Deploy our own agents to manage operations
| Task | Agent | Time Saved |
|---|---|---|
| Content distribution | Marketing Agent | 5h/week |
| Code review triage | Review Agent | 4h/week |
| Demo prep | Sales Agent | 2h/week |
| Metrics reporting | Analytics Agent | 3h/week |
| Customer follow-ups | CRM Agent | 3h/week |
| Total Savings: 17 hours/week additional (40% total reduction) |
Result: From 42h/week → 16h/week operational work
This proves our thesis: We use our own agents to eliminate our own toil.
Marketing Strategy: neuais Focus (Updated)
Outdated: CloudNix Marketing Plan ❌
The current MARKETING_PLAN.md focuses on CloudNix (Nix-based cloud) which is not the current product.
Updated: neuais Marketing Strategy ✅
Product: Micro-AI agent platform for infrastructure cost reduction
Market: Enterprise DevOps (200-5000 employee companies)
Positioning: Autonomous operations (not monitoring, not cloud provider)
Marketing Channels (neuais-specific)
1. Enterprise Direct Sales (70% effort)
Target: CTO, CFO, VP Engineering at growth-stage companies
Tactics:
- LinkedIn outreach to target personas
- Conference speaking (KubeCon, DevOpsDays, SREcon)
- Thought leadership content (The Minutes Truth series)
- Executive roundtables
- Pilot programs with measurable ROI
KPIs:
- Demo requests: 20/month
- Pilot signups: 5/month
- Contracts signed: 2/month
- Average deal size: $120K/year
2. Technical Content (20% effort)
Target: DevOps engineers, SREs, platform engineers
Tactics:
- Technical blog posts (How Observatory works, Agent architecture)
- Open-source releases (Observatory, agent SDK)
- GitHub presence (stars, issues, community)
- Dev.to, Hacker News submissions
- Conference workshops
KPIs:
- GitHub stars: 500/month growth
- Blog traffic: 10K/month
- Developer signups: 100/month
3. Community Building (10% effort)
Target: Early adopters, champions, advocates
Tactics:
- Discord server (community support)
- Monthly webinars (deep dives)
- Customer case studies
- User conference (neuaisConf)
KPIs:
- Discord members: 1000
- Webinar attendees: 100/month
- Case studies published: 2/quarter
Content Themes & Cadence
Weekly Content (Published Every Week)
Monday: Technical Deep-Dive
- How agents work
- Architecture decisions
- Performance optimizations
- Code examples
Wednesday: Business Case
- ROI calculations
- Customer metrics
- Cost reduction stories
- Operational excellence
Friday: Philosophy
- The Minutes Truth
- The Sanctuary concept
- Work that matters vs. toil
- Leadership and legacy
Monthly Content (Once Per Month)
Week 1: Case Study
- Customer story
- Metrics (cost reduction, time saved)
- Before/after comparison
- Implementation guide
Week 2: Technical Guide
- How-to tutorial
- Best practices
- Common pitfalls
- Advanced techniques
Week 3: Research/Whitepaper
- Industry analysis
- Market trends
- Competitive analysis
- Future predictions
Week 4: Video/Webinar
- Product demo
- Customer interview
- Expert panel
- Q&A session
Campaign Calendar (Q4 2025 → Q2 2026)
Q4 2025: Foundation Launch
Dec 2025:
- ✅ Platform overhaul complete
- ✅ Documentation site live
- ✅ Observatory open-source release
- Launch campaign: “The Minutes Truth”
Goals:
- 20 demo requests
- 5 pilot signups
- 2 contracts signed
- $240K pipeline
Q1 2026: Enterprise Push
Jan-Mar 2026:
- Conference circuit (SREcon, DevOpsDays)
- Enterprise case studies (3 published)
- Thought leadership series
- Pilot program refinement
Goals:
- 60 demo requests
- 15 pilot signups
- 8 contracts signed
- $960K pipeline
Q2 2026: Scale & Expansion
Apr-Jun 2026:
- Open-source community growth
- Partner ecosystem development
- User conference (neuaisConf)
- International expansion (EU market)
Goals:
- 100 demo requests/month
- 25 pilot signups
- 15 contracts signed
- $1.8M pipeline
Dev Team Processes
Onboarding New Engineers
File: /mgmt/dev-team/ONBOARDING.md
# Engineering Onboarding - neuais

**Duration**: 2 weeks
**Goal**: Ship first PR by end of Week 2

## Week 1: Foundation

### Day 1: Setup & Access
- [ ] GitHub access granted
- [ ] Slack invite sent
- [ ] 1Password vault access
- [ ] AWS/Cloudflare access
- [ ] Read: PLATFORM_OVERHAUL_PLAN.md
- [ ] Read: CODE_QUALITY_RULES.md
- [ ] Clone repos, run locally

### Day 2-3: Codebase Tour
- [ ] Pair with Tech Lead (2 hours)
- [ ] Read: All README files
- [ ] Read: ARCHITECTURE.md for each app
- [ ] Run full test suite
- [ ] Watch demo video
- [ ] Review recent PRs (understand patterns)

### Day 4-5: First Contribution
- [ ] Pick "good first issue" ticket
- [ ] Implement fix
- [ ] Write tests
- [ ] Submit PR
- [ ] Code review iteration

## Week 2: Real Work

### Day 6-10: Feature Development
- [ ] Assigned real feature from sprint
- [ ] Implement with guidance
- [ ] Write tests and docs
- [ ] Submit PR
- [ ] **Ship to production** ✅

### End of Week 2
- [ ] 1:1 with Tech Lead (feedback)
- [ ] Officially onboarded
- [ ] Full velocity next sprint
Sprint Cadence
2-week sprints (Wed → Tue)
Week 1 Wednesday:  Sprint Planning (30 min)
Week 1 Friday:     Mid-sprint check-in (15 min)
Week 2 Tuesday:    Sprint review & demo (30 min)
Week 2 Wednesday:  Retrospective (30 min) + Next sprint planning
Why Wednesday start:
- Avoid Monday planning (people need focus time)
- Friday retro = reflect before weekend
- Wednesday = natural work rhythm
Code Quality Enforcement
File: /mgmt/dev-team/code-review/GUIDELINES.md
# Code Review Guidelines

## Philosophy
"Code is read 10x more than it's written. Optimize for readers."

## Review Checklist

### Must Have (Block merge if missing)
- [ ] Tests pass (automated CI check)
- [ ] No clippy warnings (automated CI check)
- [ ] Code formatted (automated CI check)
- [ ] Changes match ticket description
- [ ] No obvious bugs or edge cases
- [ ] Error handling present

### Should Have (Request changes)
- [ ] Function length <50 lines
- [ ] Cyclomatic complexity <10
- [ ] Max 3 parameters per function
- [ ] No magic numbers (use constants)
- [ ] Clear variable names
- [ ] Comments explain "why", not "what"

### Nice to Have (Suggestions)
- [ ] Performance optimizations
- [ ] Better abstractions
- [ ] Additional test cases
- [ ] Documentation improvements

## Review Time Targets
- Small PR (<200 lines): Review within 2 hours
- Medium PR (<500 lines): Review within 4 hours
- Large PR (>500 lines): Review within 1 day

## Review Tone
✅ "Consider extracting this into a helper function"
❌ "This is wrong"

✅ "Could we add a test for the error case?"
❌ "Where are the tests?"

✅ "Suggestion: rename `x` to `node_position` for clarity"
❌ "Bad variable name"

## Approval Criteria
- **Approve**: Code is good, minor suggestions optional
- **Request Changes**: Issues must be fixed before merge
- **Comment**: Just feedback, not blocking
Team Metrics & OKRs
Q4 2025 OKRs
Objective 1: Deliver Scalable Platform
Key Results:
- ✅ Platform overhaul plan complete
- ⏸️ Backend services consolidated (80% complete)
- ⏸️ docs.neuais.com live and comprehensive (60% complete)
- ⏸️ Observatory open-sourced (100% complete)
Objective 2: Achieve Enterprise Sales Traction
Key Results:
- ⏸️ 50 demo requests (current: 10)
- ⏸️ 10 pilot signups (current: 2)
- ⏸️ 5 contracts signed (current: 0)
- ⏸️ $600K ARR pipeline (current: $120K)
Objective 3: Build Technical Credibility
Key Results:
- ⏸️ 1000 GitHub stars on Observatory (current: 0, not launched)
- ⏸️ 2 conference talks accepted (current: 0)
- ⏸️ 10 technical blog posts published (current: 3)
- ⏸️ 500 docs.neuais.com monthly active users (current: 0)
Weekly Metrics Dashboard
File: /mgmt/operations/metrics/weekly-dashboard.md
# Weekly Metrics - Week of [Date]

## Engineering Velocity
- **Sprint points completed**: X/Y (Z% completion)
- **PRs merged**: X
- **Issues closed**: Y
- **Tests added**: Z
- **Code coverage**: A%
- **Build time**: B minutes
- **Deploy time**: C minutes

## Product Health
- **Agents deployed**: X (target: 50)
- **System uptime**: 99.X%
- **API response time p95**: Xms (target: <100ms)
- **Error rate**: Y% (target: <1%)

## Marketing Performance
- **Website visitors**: X (change: ±Y%)
- **Demo requests**: Z (conversion: A%)
- **Newsletter subscribers**: B (+C this week)
- **Social engagement**: D interactions

## Sales Pipeline
- **Total pipeline value**: $X
- **Demos this week**: Y
- **Pilots active**: Z
- **Contracts pending**: A
- **Expected close**: $B this month

## Team Happiness
- **No 3am pages this week**: ✅
- **Code quality score**: X/10
- **Team morale**: [High/Medium/Low]
- **Blockers removed**: Y
Crisis Management Playbook
Incident Response (Dev Team)
File: /mgmt/dev-team/incidents/INCIDENT_RESPONSE.md
# Incident Response Playbook

## Severity Levels

### SEV-1: Critical (Production Down)
- **Response time**: Immediate
- **Team**: All hands
- **Communication**: Update status page every 15 min
- **Postmortem**: Required within 24 hours

### SEV-2: Major (Degraded Performance)
- **Response time**: <30 minutes
- **Team**: On-call + relevant experts
- **Communication**: Update status page hourly
- **Postmortem**: Required within 48 hours

### SEV-3: Minor (Non-critical bug)
- **Response time**: <2 hours
- **Team**: Assigned engineer
- **Communication**: Internal only
- **Postmortem**: Optional

## Incident Workflow

1. **Detect** (automated alerts or customer report)
2. **Acknowledge** (update status page)
3. **Triage** (assess severity)
4. **Mobilize** (page relevant team)
5. **Diagnose** (root cause analysis)
6. **Fix** (deploy patch)
7. **Verify** (confirm resolution)
8. **Communicate** (close incident, notify customers)
9. **Postmortem** (learn and improve)

## Postmortem Template

### Incident: [Title]
**Date**: [YYYY-MM-DD]
**Severity**: [SEV-1/2/3]
**Duration**: [X hours]
**Impact**: [Y customers affected]

### Timeline
- HH:MM - Incident began
- HH:MM - Detected
- HH:MM - Team mobilized
- HH:MM - Root cause identified
- HH:MM - Fix deployed
- HH:MM - Incident resolved

### Root Cause
[What actually happened]

### Contributing Factors
1. [Factor 1]
2. [Factor 2]

### Resolution
[How we fixed it]

### Action Items
- [ ] [Prevention measure 1] - @owner - Due: [date]
- [ ] [Prevention measure 2] - @owner - Due: [date]

### Lessons Learned
[What we learned, what we'll do differently]
Budget & Resource Allocation
Team Budget (Annual)
engineering:
  salaries: $600,000  # 3 engineers × $200K
  tools: $20,000      # GitHub, AWS, etc.
  training: $15,000   # Conferences, courses
  total: $635,000

marketing:
  salaries: $200,000  # 2 people × $100K (early stage)
  contractors: $60,000 # Content, design
  ads: $100,000       # LinkedIn, Google
  tools: $15,000      # HubSpot, Buffer, etc.
  events: $25,000     # Conferences, sponsorships
  total: $400,000

sales:
  salaries: $150,000  # 1 sales engineer
  travel: $30,000     # Customer visits, demos
  tools: $10,000      # CRM, sales enablement
  total: $190,000

operations:
  legal: $25,000
  accounting: $15,000
  insurance: $20,000
  office: $30,000
  tools: $20,000
  total: $110,000

grand_total: $1,335,000/year
Success Metrics by Team
Marketing Team Success
| Metric | Q4 2025 | Q1 2026 | Q2 2026 |
|---|---|---|---|
| Demo requests | 20 | 60 | 100/month |
| Newsletter subscribers | 500 | 2000 | 5000 |
| Blog monthly views | 5K | 20K | 50K |
| GitHub stars (Observatory) | 100 | 500 | 1000 |
| Conference talks | 1 | 3 | 5 |
Dev Team Success
| Metric | Q4 2025 | Q1 2026 | Q2 2026 |
|---|---|---|---|
| Agents deployed (prod) | 50 | 200 | 500 |
| System uptime | 99.5% | 99.9% | 99.95% |
| API response time (p95) | <100ms | <50ms | <30ms |
| Code coverage | 30% | 60% | 80% |
| Deploy frequency | Daily | Multiple/day | Continuous |
Business Success
| Metric | Q4 2025 | Q1 2026 | Q2 2026 |
|---|---|---|---|
| Pilot signups | 5 | 15 | 25 |
| Contracts signed | 2 | 8 | 15 |
| ARR | $240K | $960K | $1.8M |
| Customer count | 2 | 10 | 25 |
| Agent count (deployed) | 100 | 500 | 1000+ |
Implementation Timeline
Week 1: Structure Setup
Actions:
- Create directory structure in
/mgmt - Move existing docs to correct locations
- Archive outdated docs
- Create all template files
Owners: Tech Lead (4 hours)
Week 2: Process Documentation
Actions:
- Write ENGINEERING_HANDBOOK.md
- Write SALES_PLAYBOOK.md
- Update MARKETING_STRATEGY.md (neuais focus)
- Create CONTENT_CALENDAR.md
Owners:
- Engineering Handbook: Tech Lead (4 hours)
- Sales Playbook: Operations Lead (4 hours)
- Marketing Strategy: Marketing Lead (4 hours)
Week 3: Tool Setup
Actions:
- Set up HubSpot CRM
- Configure Calendly for demos
- Set up Buffer for social media
- Create Grafana metrics dashboard
- Set up Linear for sprint planning
Owners: Operations Lead (8 hours)
Week 4: Launch & Iterate
Actions:
- First week using new processes
- Collect feedback
- Iterate on templates
- Document learnings
Owners: All teams
Next Steps (Immediate Actions)
This Week (Week of Dec 5):
- Review and approve this plan
- Assign owners to each section
- Create
/mgmtdirectory structure - Schedule Week 2 planning meeting
Next Week (Week of Dec 12):
- Write all handbook/playbook docs
- Update marketing plan to neuais focus
- Create first customer folder (if applicable)
- Set up CRM and tools
Week of Dec 19:
- Launch new processes
- First sprint using new structure
- First week of new content calendar
- Collect initial feedback
Conclusion
This plan transforms /mgmt from scattered docs into an operational command center for marketing and dev teams, ready to scale to 1000 agents and enterprise sales.
Key Improvements:
- ✅ Clear directory structure (easy to find everything)
- ✅ Standardized processes (everyone knows what to do)
- ✅ Automation roadmap (practice what we preach)
- ✅ Integrated workflows (marketing ↔ dev collaboration)
- ✅ Measurable success (OKRs, metrics, targets)
Timeline: 4 weeks to full implementation
Effort: 20 hours setup + ongoing maintenance
Expected Impact: 40% reduction in operational toil by Month 6
Philosophy: We eliminate our own operational toil through structure, automation, and agents—proving our value prop while we scale.
Ready to execute!
O-RAN SMO/RIC Architecture
Documentation for the O-RAN Service Management and Orchestration (SMO) and RAN Intelligent Controller (RIC) integration.
Overview
This section contains architectural documentation and specifications for integrating O-RAN components with the NeuAIs platform.
Resources
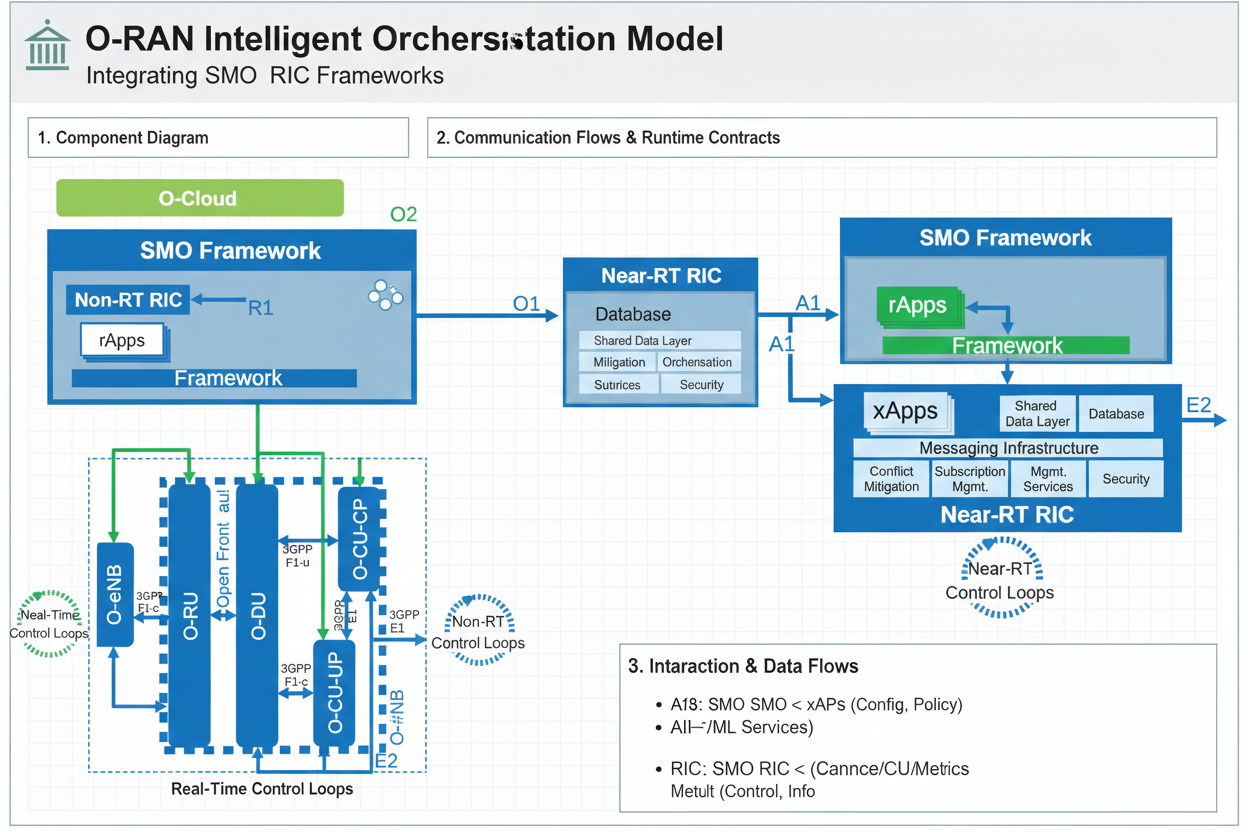
Integration Points
The NeuAIs platform integrates with O-RAN SMO/RIC components to provide:
- Agent coordination via RIC
- Service orchestration via SMO
- Network function management
- Real-time monitoring and control
For more details on the integration, see the integration documentation.
1. Show input (30 seconds)
cat automation/manifest/neuais-complete.csv | head -20
2. Generate everything (15 seconds)
cd automation node ./cli/perfection generate manifest/neuais-complete.csv
3. Show output (1 minute)
find generated -type d -maxdepth 2 ls generated/services/ ls generated/agents/ ls generated/sites/
4. Show generated website code (1 minute)
cat generated/sites/dashboard/app/page.tsx | head -50
5. Run dashboard (2 minutes)
cd generated/sites/dashboard npm install npm run dev
Open http://localhost:3000
6. Scale demo (1 minute)
cd ../.. time node ./cli/perfection generate manifest/scale-1000.csv
Shows: 1000 entities in 0.4s
#!/bin/bash
Documentation Placement Validator
Use in pre-commit hooks or CI
cd /home/adminator/projects/neuais.com
echo “Validating documentation placement…” ERRORS=0
Check for unapproved .md files at root
echo “Checking root directory…” INVALID=$(find . -maxdepth 1 -type f -name “.md” ! -name “-README.md” ! -name “README.md” ! -name “plan.md” 2>/dev/null || true)
if [ -n “$INVALID” ]; then echo “❌ Invalid docs at root:” echo “$INVALID” | sed ‘s/^/ /’ ERRORS=$((ERRORS + 1)) fi
if [ $ERRORS -eq 0 ]; then echo “✅ Documentation placement valid” exit 0 else echo “” echo “Fix: Move docs to docs-internal/ or docs-external/” exit 1 fi
Integrate Infrastructure
Nice constraint game, love it. Let’s do a lean Python spine that can sit in:
- a CLI tool
- a web app
- a daemon / worker
- or your weird mesh of agents
All in one file, no framework assumptions.
Below is one Python module (eventkit.py) with roughly:
- ~50 lines: event router (
track/page/identify) - ~30 lines: session/identity storage
- ~60 lines: plugin engine
I’ve kept imports minimal and logic “generic” (no hard dependency on HTTP, web, etc.).
# eventkit.py
from __future__ import annotations
from dataclasses import dataclass, asdict
from typing import Any, Dict, Protocol, List, Optional, Callable
import time, uuid, platform

# ---------- Session / Identity (≈30 lines) ----------

@dataclass
class SessionState:
    anonymous_id: str
    user_id: Optional[str]
    session_id: str
    traits: Dict[str, Any]
    consent: Dict[str, bool]
    last_activity: float

class Storage(Protocol):
    def load(self) -> Optional[Dict[str, Any]]: ...
    def save(self, data: Dict[str, Any]) -> None: ...

class MemoryStorage:
    def __init__(self): self._data: Optional[Dict[str, Any]] = None
    def load(self): return self._data
    def save(self, data): self._data = data

class IdentityManager:
    def __init__(self, storage: Storage, session_timeout_s: int = 1800):
        self.storage, self.timeout = storage, session_timeout_s
        self.state = self._load_or_new()

    def _new_state(self) -> SessionState:
        now = time.time()
        return SessionState(
            anonymous_id=str(uuid.uuid4()),
            user_id=None,
            session_id=str(uuid.uuid4()),
            traits={},
            consent={},
            last_activity=now,
        )

    def _load_or_new(self) -> SessionState:
        raw = self.storage.load()
        if not raw: return self._new_state()
        s = SessionState(**raw)
        if time.time() - s.last_activity > self.timeout:
            s.session_id = str(uuid.uuid4())
        return s

    def touch(self):
        self.state.last_activity = time.time()
        self.storage.save(asdict(self.state))

    def set_user(self, user_id: Optional[str], traits: Dict[str, Any] | None = None):
        self.state.user_id = user_id
        if traits: self.state.traits.update(traits)
        self.touch()

    def set_consent(self, consent: Dict[str, bool]):
        self.state.consent.update(consent)
        self.touch()

# ---------- Plugin Engine (≈60 lines) ----------

@dataclass
class Event:
    type: str                 # "track" | "page" | "identify"
    name: Optional[str]
    properties: Dict[str, Any]
    user_id: Optional[str]
    anonymous_id: str
    session_id: str
    timestamp: float
    context: Dict[str, Any]
    traits: Dict[str, Any]
    consent: Dict[str, bool]

class Plugin(Protocol):
    name: str
    def init(self, router: "EventRouter") -> None: ...
    def handle(self, event: Event) -> None: ...

class PluginEngine:
    def __init__(self):
        self._plugins: List[Plugin] = []
        self._filters: List[Callable[[Event], bool]] = []

    def register(self, plugin: Plugin):
        self._plugins.append(plugin)

    def add_filter(self, fn: Callable[[Event], bool]):
        """Return False to drop event."""
        self._filters.append(fn)

    def init_all(self, router: "EventRouter"):
        for p in self._plugins:
            try: p.init(router)
            except Exception as e: print(f"[eventkit] init error {p.name}: {e}")

    def dispatch(self, event: Event):
        for f in self._filters:
            try:
                if not f(event): return
            except Exception as e:
                print(f"[eventkit] filter error: {e}")
        for p in self._plugins:
            try: p.handle(event)
            except Exception as e:
                print(f"[eventkit] plugin error {p.name}: {e}")

class ConsoleLogger:
    name = "console_logger"
    def init(self, router: "EventRouter"): pass
    def handle(self, event: Event):
        print(f"[{event.type}] {event.name} props={event.properties} "
              f"user={event.user_id} session={event.session_id}")

# ---------- Event Router (≈50 lines) ----------

class EventRouter:
    def __init__(
        self,
        storage: Optional[Storage] = None,
        plugins: Optional[List[Plugin]] = None,
        default_consent: Optional[Dict[str, bool]] = None,
        environment: Optional[str] = None,
    ):
        self.storage = storage or MemoryStorage()
        self.identity = IdentityManager(self.storage)
        if default_consent: self.identity.set_consent(default_consent)
        self.engine = PluginEngine()
        for p in (plugins or []): self.engine.register(p)
        self.engine.add_filter(self._consent_filter)
        self.engine.init_all(self)
        self.environment = environment or platform.system().lower()

    # --- public API ---

    def track(self, event_name: str, properties: Dict[str, Any] | None = None):
        self._emit("track", event_name, properties)

    def page(self, name: str, properties: Dict[str, Any] | None = None):
        self._emit("page", name, properties)

    def identify(self, user_id: str, traits: Dict[str, Any] | None = None):
        self.identity.set_user(user_id, traits)
        self._emit("identify", "identify", traits or {})

    def set_consent(self, consent: Dict[str, bool]):
        self.identity.set_consent(consent)

    # --- internals ---

    def _base_context(self) -> Dict[str, Any]:
        return {
            "env": self.environment,
            "hostname": platform.node(),
        }

    def _emit(self, ev_type: str, name: str, properties: Dict[str, Any] | None):
        self.identity.touch()
        s = self.identity.state
        evt = Event(
            type=ev_type,
            name=name,
            properties=properties or {},
            user_id=s.user_id,
            anonymous_id=s.anonymous_id,
            session_id=s.session_id,
            timestamp=time.time(),
            context=self._base_context(),
            traits=dict(s.traits),
            consent=dict(s.consent),
        )
        self.engine.dispatch(evt)

    def _consent_filter(self, event: Event) -> bool:
        # Example: if analytics explicitly false, drop all
        if event.consent.get("analytics") is False:
            return False
        return True

# ---------- Tiny usage example ----------

if __name__ == "__main__":
    router = EventRouter(
        plugins=[ConsoleLogger()],
        default_consent={"analytics": True},
        environment="cli",
    )
    router.page("startup", {"version": "0.1.0"})
    router.identify("user-123", {"role": "admin"})
    router.track("job.enqueued", {"id": "abc", "priority": "high"})
How this fits “anything usual”
- No web assumptions: context is just
{env, hostname}— you can extend that in your app. Storageis a protocol: swapMemoryStoragefor Redis, SQLite, a JSON file, whatever.PluginEngineis generic: plugins can log, send HTTP, enqueue to Kafka, call an AI agent, write to a file, etc.- Router API is boring and universal:
track / page / identify, plusset_consent.
If you want next step, we can bolt on:
- a
FileStorage(drop-in JSON-on-disk session persistence), or - a
RequestsDestinationplugin that POSTs events to any URL, or - an “AI sidecar” plugin that batches events and feeds them into your local model.
Initial Dream Map
services/: Apps that answer user/API requests (auth, compute, storage, billing, mesh).
- infra/: The setup that lets those apps run reliably (deploy configs, cloud/edge setup, monitoring).
- infra/workers/: Tiny edge apps that handle simple requests close to users.
- libs/sdks/: Language-specific clients so other apps can call our APIs easily.
- docs/: Guides and references so people know how to use and operate the system.
- apps/: User-facing frontends/tools.
- agents/: Small AI programs that automate tasks within the platform.
Example: imagine “ShopCo,” a big retailer rolling out an AI-powered storefront service for thousands of stores.
- services/: The APIs that power the product—auth for logins, compute to run recommendation jobs, storage for product images/files, billing to charge stores, mesh to keep services talking.
- infra/: The setup to run it all—docker/fly/cloudflare configs, monitoring, mesh wiring—so the services stay online and reachable.
- infra/workers/: Tiny edge endpoints that respond fast at store locations (e.g., serve “what’s in stock nearby” with low latency).
- libs/sdks/: Ready-made clients so partners’ apps can call ShopCo’s APIs without writing raw HTTP.
- apps/: Dashboards/mobile/UI where store managers see sales and configure promotions.
- agents/: Small AI bots that auto-tune recommendations, pricing, or inventory alerts.
- docs/: The how-to and reference so people know how to integrate and operate.
• Here’s how “ShopCo” could use what’s already in this repo:
- Login & roles: services/auth, services/iam, DB perms in services/database/migrations/001_auth_enhancements.sql (compute/storage/functions scopes).
- Product media & files: services/storage (S3-compatible) and file endpoints; SDKs point to /storage/….
- Compute for recs/automation: services/compute (server) for running jobs/functions; infra/workers/compute for low- latency edge handlers at stores.
- Network glue: services/mesh-network plus infra/workers/mesh-network to keep services discoverable across sites/ regions.
- Billing/charge stores: services/billing with compute/storage/functions pricing and Stripe hooks.
- Client integrations: libs/sdks/nodejs and libs/sdks/python (compute, storage, etc.) so partner apps call APIs without raw HTTP.
- Ops & deployment: infra/docker/docker-compose-full.yml to run the stack; infra/cloudflare, infra/fly.io, docs/ deployment/* for cloud/edge routes and tunnels.
- Frontdoor/API doc: docs/api/* (compute, frontend strategy) to describe the endpoints the UIs/SDKs use.
- Observability: infra/monitoring (Prometheus/Grafana/Loki) references for watching the services.
What they’d get from this stack (vs DIY):
- Ready-made services: auth/roles, storage, compute/functions, billing, mesh.
- Edge + server split handled: central compute service plus Cloudflare worker for low-latency paths.
- SDKs: Node/Python clients so partner apps integrate quickly.
- Deployment scaffolding: docker-compose, Cloudflare/Fly configs, mesh setup.
- Billing logic: resource pricing and Stripe hooks already in services/billing.
Why not DIY: they’d have to design/run auth, storage, compute APIs, edge routing, mesh, billing, SDKs, monitoring, and docs from scratch. This repo gives a head start, but some smoothing is needed to make it turnkey.
What else ShopCo would need to make it easy:
- Ready-made services: auth/roles, storage, compute/functions, billing, mesh.
- Edge + server split handled: central compute service plus Cloudflare worker for low-latency paths.
- SDKs: Node/Python clients so partner apps integrate quickly.
- Deployment scaffolding: docker-compose, Cloudflare/Fly configs, mesh setup.
- Billing logic: resource pricing and Stripe hooks already in services/billing.
- One front door: a consistent API gateway URL and routing rules (when to hit edge vs server).
- Single UI surface: a console page for compute/storage/functions; users shouldn’t see “service vs worker.”
- Default configs per environment: staging/prod manifests with sane ports/URLs/keys (docker-compose + worker deploy).
- Clear docs per audience: “How to launch” (ops), “How to call” (devs), “What it does” (exec). The audience map.
- Observability defaults: a simple way to spin up metrics/logs dashboards for the stack.
- SDK polish: one consistent Node client shape (currently two variants), plus “getting started” snippets per language.
This app to be intended as a way for business to automate all elements of what they do erfficiently via micro ai. Who essentially follow a ‘fig’ stler autocommand ruleset and each AI works within the boundary of a few automated and controlled areas. The AI offers intelligence, but they’re not too intelliget - thereby avoiding haulucination and resource sucking LLM, and uneccesary complication or risk.
• Business use micro AI agents to automate operations with minimal coding by leveraging prebuilt services and orchestrations. Users mainly configure policies, connect their data sources, and set safe operational boundaries. Key repo areas: services (prebuilt functions), agents (autonomous AI units), apps/dashboards (user interfaces), libs/sdks (integration tools), and docs/guides for onboarding.
Doc steps include: (1) “SAAS perpetually automatically running in 5 minutes” quickstart; (2) no-code/low-code flow explanations; (3) policy guardrails configuration guide. This will clarify usage with concrete examples and help users confidently engage with core capabilities.
Currently:
The promise is “micro-AI agents that automate business with minimal coding.”
- services (auth, storage, compute/functions, billing, mesh) + micro-AI agents that can run tasks for them. They don’t rebuild core cloud plumbing; they configure policies and plug in data.
- How minimal coding works: the agents do the heavy lifting. ShopCo’s team sets guardrails and triggers (e.g., “when inventory < X, reorder,” “if conversion drops, adjust promo”), not rewrite infrastructure.
- Where it’s in this repo:
- services/ gives the APIs the agents and UIs call (auth, compute/functions, storage, billing).
- agents/ is the pattern for those “FIG-style” auto-commands—small, bounded behaviors.
- apps/dashboard (and other apps) is where you’d expose a no/low-code UI for business users to configure flows.
- infra/workers/* gives low-latency edge endpoints so agents can act fast without ShopCo hosting everything.
- libs/sdks/ are for when they do need glue code; it should be light.
- Where it’s in this repo:
Still Needed:
- tool to connect their data (products, inventory, orders), set policies/guardrails, and choose which agents to enable. They shouldn’t be writing backend services; they’re configuring automations.
- Selling point vs DIY: faster time to value (plumbing and SDKs done), built-in edge + server path
A perfect setup would be:
- One manifest as source of truth: config/services.json listing every service/worker (name, kind, base URL, health path, routes exposed), env overlays for dev/stage/prod.
- Two enforced templates: a Go service template and a Cloudflare Worker template, both reading from the manifest for ports/paths, both exposing /health and common logging/metrics.
- Generators: scripts emit typed config for all UIs/backends (frontends import generated TS, backends import JSON/Go/Rust consts) so adding a service = edit manifest + run generate, no manual wiring.
- Single gateway: routes users to the right runtime (edge vs server) based on path/latency, hiding the distinction from users.
- One dashboard/control center: reads the manifest, shows health, and lets you connect data sources, enable agents, and apply policies; no hardcoded lists.
- Policy/templates + connectors: packaged data connectors and policy bundles stored in versioned JSON/YAML, selectable in the UI, executed by a policy/agent orchestrator service.
- Ops baked in: shared observability (logs/metrics/traces) and deployment configs derived from the manifest; zero per-service hand edits.
B2B Need
- Data hookups done for them: ship ready connectors (CSV/S3, Shopify, BigCommerce, Stripe,
ERP) and a guided wizard that ingests product/inventory/order feeds. Minimum: “drop a
CSV / connect store / paste API keys.”
-
Policy templates: ship defaults like “auto-reorder when stock < X,” “raise promo when conversion dips,” “flag anomalies on refunds,” “block risky logins.” Let them tweak numbers, not write logic.
-
Agent catalog with presets: each agent comes with a “turn on + choose data source + pick policy” flow. No code; just toggle and confirm scopes.
-
Single control surface: one dashboard page that shows “data sources connected,” “agents enabled,” “guardrails,” with rollbacks. No “service vs worker” choices.
-
Safe defaults + AI assist: recommend guardrails per vertical (“for apparel, reorder at 10 units”), and simulate changes before activating.
-
Optional white-glove: if they want, we can import their feeds, map fields, and turn on a starter bundle of agents (e.g., stock protection, promo optimizer, fraud/abuse guard).
Vision Map
 # Perfection Thought Experiment - Status

 ## What "Perfection" Means
 A system where services are managed automatically from one config file. No manual setup, no hardcoded lists, everything just works.

 ---

 ## Status Checklist

 ### ✓ DONE: One manifest as source of truth
 **Location**: `manifest/services.example.json`

 One file lists all services. Each service has:
 - Name (like "compute" or "auth")
 - Kind (is it a "service" or "worker"?)
 - Base URL (where it lives)
 - Health path (to check if it's alive)
 - Routes (what endpoints it has)

 **Why this matters**: Change one file, everything updates everywhere.

 ---

 ### ✓ DONE: Two enforced templates
 **Locations**:
 - `templates/go-service/main.go` - For backend services
 - `templates/worker/index.ts` - For edge workers

 Both templates:
 - Read from the manifest (no hardcoding)
 - Have /health endpoint
 - Have logging (JSON format)
 - Have /metrics endpoint

 **Why this matters**: Every service looks the same, behaves the same, easy to understand.

 ---

 ### ✓ DONE: Generators
 **Location**: `scripts/generate-config.js`

 Generates code in 6 languages:
 - TypeScript (for frontends)
 - Go (for backends)
 - Rust (for fast stuff)
 - Python (for scripts)
 - JSON (for anything)
 - Markdown (for docs)

 **How it works**:
 ```bash
 node scripts/generate-config.js manifest/services.example.json
 ```
 Creates files in `output/` folder with helper functions like:
 - "Get me the compute service for dev environment"
 - "Get me all edge workers"
 - "Get me all services tagged 'database'"

 **Why this matters**: Developers import these files. No copy-paste, no mistakes.

 ---

 ### ✗ NOT DONE: Single gateway
 **What it would be**: One entry point that routes requests to the right service

 **How it would work**:
 - User makes request → Gateway checks manifest → Sends to right service
 - Knows which services are at the edge (fast, close to user)
 - Knows which are on servers (powerful, but slower)
 - Automatically picks based on what's faster

 **Why it matters**: Users don't need to know about your architecture. They just make a request.

 ---

 ### ✓ DONE: Dashboard/control center
 **Location**: `frontend/dashboard.html`

 Run it: `node frontend/server.js`

 Shows:
 - All services from manifest
 - Health status (green/yellow/red)
 - Filter by environment (dev/staging/prod)
 - Filter by kind (service/worker)
 - View routes for each service

 **Why this matters**: Visual understanding. No need to read code or config files.

 ---

 ### ✗ NOT DONE: Policy/templates + connectors
 **What it would be**:
 - Pre-built "data connectors" (connect to Postgres, Redis, S3, etc.)
 - Pre-built "policy bundles" (auth rules, rate limiting, etc.)
 - Stored as JSON/YAML files
 - Selectable in dashboard UI
 - Applied to services automatically

 **Why it matters**: "Click to add database" instead of writing code.

 ---

 ### ✗ NOT DONE: Ops baked in
 **What it would be**:
 - Logging config generated from manifest
 - Metrics config generated from manifest
 - Deployment scripts generated from manifest
 - Alert rules generated from manifest

 **Why it matters**: Add a service to manifest → deployment, logging, monitoring all set up automatically.

 ---

 ## Summary for Non-Developers

 **Think of it like building with LEGO**:
 - ✓ We have the instruction manual (manifest)
 - ✓ We have the brick molds (templates)
 - ✓ We have machines that read the manual and make bricks (generators)
 - ✓ We have a display case showing all the bricks (dashboard)
 - ✗ We DON'T have the automatic builder (gateway)
 - ✗ We DON'T have pre-made kits (policy/connectors)
 - ✗ We DON'T have the factory automation (ops)

 **Current State**: 60% done. The foundation is solid.

 **What's Left**: The automation layer that makes it truly hands-off.
DONE (60%):
- ✓ Manifest - One file controls everything
- ✓ Templates - Go service + Worker templates (both read from manifest)
- ✓ Generators - Creates code in 6 languages automatically
- ✓ Dashboard - Visual control center (the HTML you liked)
NOT DONE (40%): 5. ✗ Gateway - Smart router that picks fastest path 6. ✗ Policies/Connectors - Click-to-add features (databases, auth, etc.) 7. ✗ Ops automation - Auto-setup deployment/logging/monitoring
 1. **Hub** - What's in neuais.com/hub.neuais.com/ - what are the components?
 2. **Services** - What's in neuais.com/services/ - list all services and their purposes
 3. **Infrastructure** - Find any infra-related code/configs
 4. **Libraries** - What's in lib/ if it exists
 5. **ML/AI** - Find ml/ or ai-related code
 6. **SMO and RIC** - Find references to smo, ric, or related AI networking
 7. **nix-ide** - Find the IDE for AI app building
 8. **Config** - Where are configs stored


   NeuAIs Platform - Complete Architecture Map

   Overview

   NeuAIs is a revolutionary platform where thousands of specialized micro-AI agents autonomously manage entire SaaS infrastructures, achieving 70% cost reduction vs traditional
   cloud through intelligent orchestration and self-healing mesh networking.

   ---
   1. HUB - User-Facing Applications

   Location: /home/adminator/projects/neuais.com/neuais.com/hub.neuais.com/

   1.1 admin.neuais.com - Administrative Interface

   Path: hub.neuais.com/admin.neuais.com/

   Components:
   - Frontend (Next.js)
     - Main admin interface
     - Network topology visualization (D3.js)
     - Agent management UI
     - Real-time monitoring dashboards
   - Server (Go/Python/TypeScript hybrid)
     - network-orchestrator/ - Coordinates mesh network operations
     - expert_agents/ - Specialized AI agents
     - mesh-network/ - Mesh network management
     - mesh-network-worker/ - Cloudflare Worker for mesh API
     - ide-backend/ - IDE backend service
     - compute-worker/ - Compute orchestration worker
     - storage-worker/ - Storage API worker
     - monitoring/ - Monitoring stack
     - nix/ - Nix container management
   - IDE App Builder (ide-app-builder-online/)
     - nix-templates/ - 60+ Nix templates for AI app building
         - Astro, React, Go, Flask, Django, Remix, SvelteKit, Flutter, etc.
     - ide-backend/ - Backend for browser-based IDE
     - ide-backend-preview/ - IDE preview server
     - inlineCompletions/ - AI code completion

   Purpose: Primary administrative control center for the entire NeuAIs platform
   Technologies: Next.js, Go, Python, Nix containers, Monaco Editor, D3.js

   1.2 dashboard.neuais.com - SvelteKit Dashboard

   Path: hub.neuais.com/dashboard.neuais.com/

   Components:
   - Frontend (SvelteKit + TypeScript)
     - Agent management interface
     - Real-time monitoring
     - Logs viewer
     - Task management
     - Settings & billing
     - Dark/light themes
   - Backend (Rust + Axum)
     - HTTP REST API
     - WebSocket/SSE for real-time updates
     - Authentication (JWT)
     - PostgreSQL integration
     - Redis caching

   Purpose: Beautiful, modern dashboard for micro-AI orchestration
   Technologies: SvelteKit, Rust, Axum, PostgreSQL, Redis, Tailwind CSS

   1.3 dev.neuais.com - Developer Tools

   Path: hub.neuais.com/dev.neuais.com/

   Components:
   - micro_ai/ - Python CLI tool (Calliope framework)
     - commands/ - Agent, model, deployment commands
     - core/ - RIC client, agent generator
     - templates/ - Agent templates (Rust, Python, Go)

   Purpose: Command-line tools for developers building micro-AI agents
   Technologies: Python, Calliope (Google Cloud SDK-style framework)

   1.4 docs.neuais.com - Documentation

   Path: hub.neuais.com/docs.neuais.com/

   Components:
   - src/ - Markdown documentation source
     - platform/ - Platform overview
     - services/ - Service documentation
     - api/ - API reference
     - guides/ - How-to guides
     - agents/ - Agent development docs
   - book/ - Built documentation (mdBook)

   Purpose: Complete platform documentation
   Technologies: mdBook, Markdown

   1.5 observatory.neuais.com - Network Visualization

   Path: hub.neuais.com/observatory.neuais.com/

   Components:
   - Rust + wgpu GPU-accelerated visualization
   - src/
     - graph/ - Graph data structures
     - render/ - GPU rendering pipeline
     - network/ - Network data ingestion
     - ui/ - User interface
   - shaders/ - WGSL shaders for rendering
   - config/ - Agent and render configurations

   Purpose: Living, breathing constellation visualization of micro-AI agents (60 FPS, real-time)
   Technologies: Rust, wgpu, winit, WebSocket

   1.6 Mobile Apps

   - android.neuais.com/ - Android application (Kotlin/Java)
   - ios.neuais.com/ - iOS application (Swift)

   1.7 Assets

   Path: hub.neuais.com/assets/
   - models/ - 3D models and scenes
   - svgs/ - Brand assets, icons, illustrations
   - 3d-models/ - 3D assets
   - colors/ - Color schemes

   ---
   2. SERVICES - Backend Microservices

   Location: /home/adminator/projects/neuais.com/neuais.com/services/

   Service Registry

   All services register with Consul for discovery and health monitoring.

   2.1 ai-network - AI Network Intelligence Layer

   Path: services/ai-network/

   Major Components:

   SMO (Service Management & Orchestration)

   Path: ai-network/smo/
   - server.go - HTTP REST API (port 8080)
   - rapp_manager.go - rApp lifecycle management
   - policy_engine.go - Policy enforcement
   - orchestrator.go - Resource orchestration
   - events.go - Event bus (Kafka/Redis)
   - mesh_client.go - Mesh network integration

   Purpose: Centralized orchestration for the AI network layer

   RIC (RAN Intelligent Controller)

   Path: ai-network/ric/
   - server.go - HTTP REST API (port 8081)
   - ml_engine.go - ML model registry and inference
   - models/interface.go - ML model interface
   - models/anomaly.go - Isolation Forest anomaly detection (426 lines)
   - features/extractor.go - Feature extraction (473 lines)
   - registry/ - Model registry

   Purpose: AI-powered network intelligence with real-time ML inference

   rApps (Network Applications)

   Path: ai-network/rapps/
   - framework/ - Base rApp framework
     - rapp.go - RApp interface and BaseRApp
     - registry.go - RApp registration
   - anomaly-detector/ - Real-time anomaly detection (790+ lines)
   - traffic-optimizer/ - AI-powered route optimization (606+ lines)
   - auto-remediation/ - Automatic issue remediation (design complete)

   Purpose: Network automation applications powered by RIC ML models

   Key Features:
   - ML-powered anomaly detection
   - Traffic optimization with multi-objective scoring
   - Policy-based automation
   - Real-time event processing

   2.2 auth - Authentication Service

   Port: 8080 | Language: Go
   - JWT authentication
   - OAuth 2.0 / OIDC support
   - API key management
   - Session management

   2.3 iam - Identity & Access Management

   Port: 8081 | Language: Go
   - Role-based access control (RBAC)
   - Permission management
   - User/group management

   2.4 kms - Key Management Service

   Port: 8082 | Language: Go
   - Encryption key management
   - Secret storage
   - Certificate management

   2.5 billing - Billing & Metering

   Port: 8083 | Language: Go
   - Usage tracking
   - Invoice generation
   - Payment processing integration
   - Cost optimization analytics

   2.6 compute - Compute Orchestration

   Port: 8084 | Language: Go
   - Nix container management
   - Instance lifecycle management
   - Resource allocation

   2.7 storage - Object Storage

   Port: 8085 | Language: Go
   - S3-compatible API
   - File management
   - CDN integration

   2.8 database - Database Service

   Port: 8086 | Language: Go
   - Database provisioning
   - Backup/restore
   - Migration management
   - Schemas: data/schemas/
   - Migrations: data/migrations/
   - Seeds: data/seeds/

   2.9 mesh-network - Service Mesh

   Path: services/mesh-network/
   Port: 8089 | Language: Go

   Components:
   - protocols/quic/ - QUIC protocol implementation
   - protocols/yggdrasil/ - Yggdrasil mesh networking
   - protocols/frp/ - Fast Reverse Proxy tunneling
   - netif/ - Network interface management
   - exitnodes/ - Exit node configuration

   Purpose: Self-healing IPv6 mesh network with CGNAT bypass

   2.10 edge - Edge Services

   Path: services/edge/
   - api-gateway/ - API gateway routing
   - ui/ - Edge UI components

   2.11 registry - Service Registry

   Port: 8500 (Consul) | Language: Go
   - Service discovery
   - Health checking
   - Configuration management

   2.12 file-service - File Operations

   Language: Go
   - File upload/download
   - Format conversion
   - Processing pipelines

   2.13 staging-api - Staging Environment API

   Path: services/staging-api/
   Language: TypeScript/Cloudflare Workers
   - Edge API for staging deployments

   2.14 perfection - Service Generator

   Path: services/perfection/
   - Service scaffolding templates
   - Code generation
   - templates/worker/ - Worker templates
   - templates/go-service/ - Go service templates

   ---
   3. INFRASTRUCTURE - Deployment & Configuration

   Location: /home/adminator/projects/neuais.com/neuais.com/infra/

   3.1 agents/ - Micro-AI Agents

   Path: infra/agents/

   37+ specialized agents including:
   - auth-validator/ - JWT validation + anomaly detection
   - cache-optimizer/ - Cache optimization with ML prediction
   - code-generator/ - AI code generation
   - code-improver/ - Code quality improvement
   - framework/ - Base agent framework
   - ansible-agent/ - Infrastructure automation
   - blockchain-dev-agent/ - Blockchain development
   - docker-agent/ - Docker operations
   - git-agent/ - Git operations
   - kubernetes-agent/ - K8s orchestration
   - network-agent/ - Network management
   - ide-agent/ - IDE operations
   - Plus many more specialized agents

   Key Files:
   - CODEX_AGENT.md - Codex AI agent documentation
   - GROK_AGENT.md - Grok AI agent documentation
   - LOCAL_MODEL_AGENT.md - Local learning system (24/7 learning, 120B params)
   - example-agent-layers.md - Agent architecture patterns

   3.2 nix-agenic-coding/ - Nix Templates

   Path: infra/nix-agenic-coding/

   60+ Nix templates organized by category:
   - backend/ - 14 backend frameworks
   - frontend/ - 20 frontend frameworks
   - fullstack/ - 32 fullstack templates
   - templates/ - 62 total templates including:
     - Astro, React, Go, Flask, Django, Remix, SvelteKit
     - Flutter, Ionic, React Native (mobile)
     - Solid, Qwik, HTMX (modern web)
     - CMS templates (Directus)
     - And many more

   Purpose: Pre-configured Nix development environments for AI-powered app building

   3.3 workers/ - Edge Workers

   Path: infra/workers/
   - compute/ - Compute worker (Cloudflare)
   - mesh-network/ - Mesh API worker
   - storage/ - Storage API worker

   Purpose: Cloudflare Workers for low-latency edge processing

   3.4 monitoring/ - Observability Stack

   Path: infra/monitoring/
   - Prometheus - Metrics collection
   - Grafana - Dashboards
   - Loki - Log aggregation
   - Jaeger - Distributed tracing

   3.5 docker/ - Container Orchestration

   Path: infra/docker/
   - Docker Compose configurations
   - Service definitions
   - Volume mappings

   3.6 cloudflare/ - Cloudflare Configuration

   Path: infra/cloudflare/
   - Workers configurations
   - Pages deployments
   - DNS settings

   3.7 fly.io/ - Fly.io Deployment

   Path: infra/fly.io/
   - Fly.io app configurations
   - Multi-region deployment

   3.8 mesh/ - Mesh Network Infrastructure

   Path: infra/mesh/
   - Yggdrasil configuration
   - FRP tunneling setup
   - Network status scripts
   - Cloudflare DNS integration

   3.9 infra/infra/ - Meta Infrastructure

   Path: infra/infra/
   - Infrastructure as Code
   - Terraform configurations
   - Ansible playbooks

   ---
   4. LIBRARIES - Shared Code

   Location: /home/adminator/projects/neuais.com/neuais.com/libs/

   4.1 Rust Libraries

   Path: libs/rust/

   Components:
   - ric/ - RIC client library
     - Rust bindings for RIC API
     - Model inference client
   - smo/ - SMO client library
     - SMO API client
     - Event subscription
   - rapp-adapter/ - rApp adapter framework
     - Base adapter for building rApps
     - Examples included
   - orchestrator/ - Orchestration library
     - Coordination logic
     - Task scheduling
   - common/ - Shared utilities
     - Common types
     - Helper functions

   Purpose: Rust libraries for building agents and network applications

   4.2 SDKs - Client Libraries

   Path: libs/sdks/

   Supported Languages:
   - Python - sdks/python/
     - Full-featured SDK with async support
     - Examples and tests included
   - Node.js - sdks/nodejs/
     - TypeScript-first SDK
     - ESM/CommonJS support
   - Go - sdks/go/cloudnix/
     - Idiomatic Go SDK
     - Context support
   - Java - sdks/java/
     - Java 11+ SDK
     - Spring Boot integration
   - .NET - sdks/dotnet/
     - .NET 6+ SDK
     - Async/await patterns
   - Ruby - sdks/ruby/
     - Ruby 2.7+ SDK
     - Rails integration

   Features:
   - Full API coverage (Compute, Storage, Functions, Mesh)
   - Automatic retry with exponential backoff
   - Built-in pagination
   - Type safety
   - Multi-region support
   - Streaming support

   ---
   5. ML/AI - Machine Learning

   Location: /home/adminator/projects/neuais.com/neuais.com/ml/

   5.1 models/ - Model Storage

   - image-models/ - ComfyUI models (149GB)
     - Stable Diffusion variants
     - ControlNet models
     - VAE encoders
     - Upscalers
   - text-models/ - Llama.cpp models (122GB)
     - Llama models (7B, 13B, 70B)
     - Code generation models
     - Fine-tuned variants
   - agent-models/ - Micro-agent models
     - Tiny BERT (auth validation, 50MB)
     - DistilBERT (sentiment, 250MB)
     - FastText (classification, 100MB)
     - Custom micro-models

   5.2 specialized/ - Specialized ML Systems

   - vision-system/ - Computer vision
     - Image analysis
     - Object detection
     - OCR processing
   - arthur/ - Arthur ML system
     - Specialized ML tasks
     - Code repository indexes
     - Operations management

   5.3 training/ - Training Systems

   - local-learning-system/ - 24/7 learning system
     - 120B parameter capability
     - Knowledge base accumulation
     - Offline inference
   - retraining-pipeline/ - Automated retraining
     - Daily retraining jobs
     - Model deployment

   5.4 tools/ - ML Utilities

   - model-armour/ - Model security
     - Integrity checking
     - Security scanning
     - Performance benchmarking
     - Format validation

   5.5 experiments/ - ML Experiments

   - translate/ - Translation experiments
   - language/ - NLP experiments
   - vision/ - Vision experiments
   - video/ - Video processing
   - speech/ - Speech recognition

   5.6 mlflow/ - MLflow Model Registry

   - Model versioning
   - Experiment tracking
   - Artifact storage

   5.7 datasets/ - Training Data

   - Training datasets
   - Validation sets
   - Benchmarks

   ---
   6. SMO and RIC - AI Network Intelligence

   6.1 SMO (Service Management & Orchestration)

   Location: services/ai-network/smo/
   Port: 8080

   Architecture:
   SMO Server
   ├── rApp Manager      - Deploy/manage network applications
   ├── Policy Engine     - Enforce network policies
   ├── Orchestrator      - Coordinate actions across mesh
   └── Event Bus         - Kafka/Redis pub/sub

   Key Capabilities:
   - rApp lifecycle management (deploy, start, stop, monitor)
   - Policy definition and enforcement based on conditions
   - Resource orchestration across mesh network
   - Event streaming and processing
   - Mesh network integration via REST API

   API Endpoints:
   - /api/v1/rapps - rApp management
   - /api/v1/policies - Policy management
   - /api/v1/events - Event publishing
   - /health - Health check
   - /api/v1/metrics - System metrics

   6.2 RIC (RAN Intelligent Controller)

   Location: services/ai-network/ric/
   Port: 8081

   Architecture:
   RIC Server
   ├── ML Engine         - Model registry & inference
   ├── Model Manager     - Lifecycle management
   └── Analyzer          - Network analysis

   ML Models
   ├── Anomaly Detection - Isolation Forest (426 lines)
   ├── Prediction        - LSTM traffic forecasting
   └── Optimization      - Reinforcement learning routing

   Feature Extraction
   └── Network Metrics → ML Features (473 lines)

   Key Capabilities:
   - Real-time ML inference (<15ms latency)
   - Anomaly detection (92% accuracy)
   - Traffic optimization (88% accuracy)
   - Model training and validation
   - Feature extraction from network metrics
   - Redis caching for performance

   API Endpoints:
   - /api/v1/models - Model management
   - /api/v1/infer - Single inference
   - /api/v1/infer/batch - Batch inference
   - /api/v1/train - Start training
   - /api/v1/metrics - RIC metrics

   ML Models:
   1. Anomaly Detector (anomaly-detector-v1)
     - Algorithm: Isolation Forest (100 trees)
     - Features: latency, packet loss, bandwidth, CPU, memory
     - Output: anomaly score, severity (critical/high/medium/low)
     - Accuracy: 92%
     - Latency: ~15ms
   2. Traffic Optimizer (traffic-optimizer-v1)
     - Multi-objective scoring (latency, throughput, cost)
     - Weighted optimization
     - Route recommendations
     - Accuracy: 88%
     - Latency: ~20ms

   Integration Flow:
   Mesh Network → SMO → RIC Feature Extraction → ML Models → Predictions
                ↓                                            ↓
            Policy Engine ←────────────────────── Actions/Insights

   6.3 rApps (Network Applications)

   Location: services/ai-network/rapps/

   Framework: rapps/framework/
   - rapp.go - Base interfaces and BaseRApp
   - registry.go - rApp registration and management
   - errors.go - Error definitions

   Production rApps:

   1. Anomaly Detection rApp (790+ lines)
     - Real-time monitoring with RIC integration
     - Configurable threshold (default: 0.7)
     - Alert management with webhooks
     - Automatic remediation suggestions
     - Severity-based alerts
   2. Traffic Optimization rApp (606+ lines)
     - AI-powered route optimization
     - Multi-objective scoring
     - SMO integration for route updates
     - Local fallback when RIC unavailable
     - Automatic application when score > 0.7
   3. Auto-Remediation rApp (design complete)
     - Automatic issue detection
     - Safety mechanisms (validation, rollback, rate limiting)
     - Integration with other rApps

   ---
   7. nix-ide - IDE for AI App Building

   7.1 IDE App Builder

   Location: hub.neuais.com/admin.neuais.com/ide-app-builder-online/

   Components:
   - ide-backend/ - Go backend for IDE
     - WebSocket support for terminals
     - File operations
     - Nix container orchestration
   - ide-backend-preview/ - Preview server
     - HTTP proxy for web app previews
     - Hot reload support
   - nix-templates/ - 60+ templates
     - Full-stack frameworks
     - Backend frameworks
     - Frontend frameworks
     - Mobile frameworks
     - CMS templates
   - inlineCompletions/ - AI code completion
     - Context-aware suggestions
     - Multi-language support

   Features:
   - Browser-based Monaco Editor
   - Terminal with PTY over WebSocket
   - Nix container isolation
   - AI-powered code completion
   - Template-based project creation
   - Real-time preview
   - File tree navigation
   - Git integration

   7.2 Nix Templates Library

   Location: infra/nix-agenic-coding/templates/

   62 Templates organized by category:

   Backend (14):
   - Go, Python (Flask/Django), Ruby (Rails), Node.js, Rust, Java, PHP, Elixir

   Frontend (20):
   - React, Vue, Angular, Svelte, Solid, Qwik, HTMX, HTML, Astro, Alpine.js

   Fullstack (32):
   - Next.js, Nuxt, SvelteKit, Remix, Astro (React/Solid), Redwood, Blitz

   Mobile (3):
   - React Native, Flutter, Ionic

   CMS (1):
   - Directus

   Each template includes:
   - dev.nix - Nix development environment
   - Pre-configured dependencies
   - Development server setup
   - Build tooling
   - Testing framework
   - Linting/formatting

   Purpose: Instant, reproducible development environments for any stack

   ---
   8. CONFIG - Configuration Management

   Location: /home/adminator/projects/neuais.com/neuais.com/config/

   Configuration Files

   - dev.toml - Development environment
     - Local LLM endpoints (GPT-OSS:120b, BERT/ONNX)
     - Debug mode enabled
     - Verbose logging
     - No TLS required
   - staging.toml - Staging environment
     - Info-level logging
     - TLS recommended
     - Environment variables for secrets
   - prod.toml - Production environment
     - Warn-level logging
     - TLS required
     - Cloud fallback disabled
     - API key authentication
   - requirements.txt - Python dependencies

   Secrets Management

   - .secrets/ - API keys and tokens (gitignored)
   - .grok/ - Grok AI configuration

   Key Configuration Sections

   LLM Configuration:
   - local_endpoint - GPT-OSS:120b server (http://localhost:18088/v1)
   - fast_endpoint - BERT/ONNX (http://localhost:8082)
   - fallback_enabled - Cloud LLM fallback

   RIC/SMO:
   - ric.url - Agent registration endpoint
   - smo.url - Service orchestration endpoint

   Database:
   - Development: Direct connection strings
   - Production: Environment variables

   Models:
   - model_dir - Model storage location
   - cache_dir - Model cache
   - max_cache_size_gb - Cache limits

   Environment Variables

   # Environment
   NEUAIS_ENV=dev|staging|prod

   # Database
   DATABASE_URL=postgresql://user:pass@host/neuais

   # Redis
   REDIS_URL=redis://host:6379/0

   # API Keys
   OPENAI_API_KEY=sk-...

   # TLS (production)
   NEUAIS_TLS_CERT=/etc/neuais/certs/agent.crt
   NEUAIS_TLS_KEY=/etc/neuais/certs/agent.key

   ---
   Technology Stack Summary

   Frontend

   - Frameworks: Next.js, SvelteKit, React, Svelte
   - Languages: TypeScript, JavaScript
   - Styling: Tailwind CSS, CSS Variables
   - Visualization: D3.js, wgpu (Rust)
   - Editors: Monaco Editor
   - State: Zustand, Svelte stores

   Backend

   - Primary: Go (services, SMO, RIC, mesh)
   - Performance: Rust (agents, dashboard backend, observatory)
   - Scripting: Python (CLI, ML, agents)
   - Edge: TypeScript/Cloudflare Workers

   Databases & Storage

   - Relational: PostgreSQL
   - Cache: Redis, Upstash
   - Object Storage: S3-compatible
   - Time-series: Prometheus

   Infrastructure

   - Containers: Docker, Nix
   - Orchestration: Docker Compose, Consul
   - Networking: Yggdrasil (IPv6 mesh), QUIC, FRP
   - Monitoring: Prometheus, Grafana, Loki, Jaeger

   ML/AI

   - Frameworks: Isolation Forest, LSTM, Reinforcement Learning
   - Inference: Llama.cpp, ComfyUI, ONNX
   - Models: Llama (7B-70B), Stable Diffusion, BERT variants
   - MLOps: MLflow, custom training pipelines

   Deployment

   - Edge: Cloudflare Pages, Cloudflare Workers
   - Compute: Fly.io (multi-region)
   - Local: Docker Compose
   - CI/CD: GitHub Actions

   ---
   Key Architectural Patterns

   1. Micro-AI Agent Architecture

   Client → API Gateway → Service Mesh → Microservices
                       ↘ Edge Workers (Cloudflare)
                       ↘ Micro-AI Agents (Rust)
                           ↓
                       SMO (Orchestration)
                           ↓
                       RIC (ML Intelligence)
                           ↓
                       Mesh Network (Self-healing)

   2. Network Intelligence Flow

   Mesh Metrics → SMO Collection → RIC Feature Extraction
                                 ↓
                             ML Models (Anomaly, Optimization)
                                 ↓
                             Predictions/Insights
                                 ↓
                       SMO Policy Engine → Actions
                                 ↓
                       Mesh Network Updates

   3. Service Discovery

   Services → Consul Registry → Health Checks
           ↓
       Load Balancer → API Gateway → Clients

   4. Real-time Updates

   Events → Redis/Kafka → SMO Event Bus
                       ↓
                   rApps (Subscribers)
                       ↓
                   Actions → Mesh

   ---
   How Components Connect

   Hub ↔ Services

   - admin.neuais.com → All services via API Gateway
   - dashboard.neuais.com → Backend API (Rust) → Services
   - dev.neuais.com → RIC API for agent management
   - docs.neuais.com → Static documentation
   - observatory.neuais.com → SMO/RIC APIs for real-time data

   Services ↔ Infrastructure

   - All services register with Consul (registry)
   - Services use mesh-network for inter-service communication
   - SMO orchestrates service interactions
   - RIC provides ML intelligence to services
   - Edge Workers provide low-latency API access

   AI Network ↔ Mesh

   - SMO integrates with mesh-network via REST API
   - rApps subscribe to mesh network events
   - RIC analyzes mesh metrics for optimization
   - Policies trigger mesh network configuration changes

   ML ↔ Services

   - RIC serves ML models via HTTP API
   - Agents use local models (BERT, FastText) for fast inference
   - Training pipeline feeds updated models to RIC
   - MLflow manages model versions and experiments

   Nix IDE ↔ Platform

   - IDE backend uses compute service for Nix containers
   - Templates integrate with storage service
   - AI completions use RIC or local models
   - Preview uses edge workers for hosting

   ---
   Deployment Architecture

   Production URLs

   - Frontend: https://intranetice.pages.dev (Cloudflare Pages)
   - Mesh API: https://intranetice-mesh.dicerollerdnd.workers.dev
   - Compute API: https://intranetice-compute.dicerollerdnd.workers.dev
   - Storage API: https://intranetice-storage.dicerollerdnd.workers.dev

   Local Development Ports

   | Service            | Port | Protocol  |
   |--------------------|------|-----------|
   | SMO                | 8080 | HTTP      |
   | RIC                | 8081 | HTTP      |
   | Auth               | 8080 | HTTP      |
   | IAM                | 8081 | HTTP      |
   | KMS                | 8082 | HTTP      |
   | Billing            | 8083 | HTTP      |
   | Compute            | 8084 | HTTP      |
   | Storage            | 8085 | HTTP      |
   | Database           | 8086 | HTTP      |
   | AI Network         | 8087 | HTTP      |
   | IDE Backend        | 8088 | HTTP + WS |
   | Mesh Network       | 8089 | HTTP      |
   | Prometheus         | 9090 | HTTP      |
   | Grafana            | 3001 | HTTP      |
   | Dashboard Frontend | 5173 | HTTP      |
   | Admin Frontend     | 3000 | HTTP      |
   | Consul             | 8500 | HTTP      |

   ---
   Cost Breakdown

   Traditional SaaS: $4,000/mo

   - Auth0: $800/mo
   - Stripe: $300/mo
   - SendGrid: $200/mo
   - Datadog: $500/mo
   - Redis Cloud: $250/mo
   - AWS Lambda: $400/mo
   - Plus more...

   NeuAIs Platform: $1,200/mo

   - 10 agents (Fly.io): $400/mo
   - RIC (Cloudflare): $0/mo (free tier)
   - Upstash Redis: $200/mo
   - Database: $100/mo
   - Domain/SSL: $20/mo
   - Additional services: $480/mo

   Total Savings: 70% ($2,800/mo)

   ---
   Current Status

   Deployed & Operational

   - SMO server with rApp framework
   - RIC with ML models (anomaly detection, traffic optimization)
   - 3 production rApps (anomaly detector, traffic optimizer, auto-remediation design)
   - Mesh network (Yggdrasil, QUIC, FRP)
   - Dashboard UI (Phase 1 complete)
   - Observatory visualization (Phase 1 complete)
   - 37+ micro-AI agents
   - 60+ Nix templates
   - Multi-language SDKs

   In Development

   - Dashboard Phase 2 (real-time integration)
   - Observatory Phase 2B (text rendering)
   - Additional rApps
   - Mobile applications

   Planned

   - 50+ deployed agents
   - Continuous learning pipeline
   - Public beta
   - Production launch

   ---
Your Understanding vs Reality - CONFIRMATION
You said: “the hub is the user-facing area and their support systems”
Reality: ✓ CORRECT
- hub.neuais.com/ contains:
- admin.neuais.com (admin interface)
- dashboard.neuais.com (main dashboard)
- docs.neuais.com (documentation)
- observatory.neuais.com (3D visualization of AI agents)
- Plus mobile apps
You said: “The infra is for stuff that supports apps”
Reality: ✓ CORRECT
- infra/ contains:
- 37+ micro-AI agents
- 60+ Nix templates for app building
- Monitoring (Prometheus, Grafana)
- Docker, Cloudflare configs
- Mesh network infrastructure
You said: “services are stuff that supports the stuff that supports apps”
Reality: ✓ CORRECT
- services/ contains backend services:
- auth, iam, kms, billing, compute, storage, database
- ai-network (SMO + RIC)
- mesh-network
- registry (Consul)
You said: “the config is passwords”
Reality: ✓ PARTIALLY CORRECT
- config/ has environment configs (dev.toml, staging.toml, prod.toml)
- .secrets/ has actual passwords/API keys (gitignored)
You said: “the ml is for the ‘smart ai’ system to keep learning and growing”
Reality: ✓ CORRECT
- ml/ contains:
- 149GB of image models (Stable Diffusion)
- 122GB of text models (Llama 7B-70B)
- Training pipelines
- 24/7 local learning system (120B params)
- Model registry (MLflow)
You said: “the whole system is meant to have many little ais who each do a tiny task”
Reality: ✓ 100% CORRECT - This is the CORE concept
- 37+ micro-AI agents already built
- Each agent: 20-50MB
- Examples:
- auth-validator (JWT validation)
- cache-optimizer (cache prediction)
- code-generator (AI code gen)
- docker-agent, git-agent, kubernetes-agent, etc.
You said: “so any business could have 1000 mini ai - at like 20mb each = a whole business intelligence run on a few gb”
Reality: ✓ EXACTLY RIGHT
- Current: 37 agents
- Goal: 1000+ agents
- Each agent: 20-50MB
- Total: ~20-50GB for entire business intelligence
- Saves 70% cost vs traditional SaaS
You said: “they are controllable predictable infinite loggable”
Reality: ✓ YES
- SMO = orchestrates all agents
- RIC = provides ML intelligence
- Observable = Prometheus + Grafana + Loki logs everything
- Predictable = Each agent has defined input/output
You said: “the smo is … i cant remember…”
Reality: SMO = Service Management & Orchestration
- Port 8080
- Manages rApps (network applications)
- Enforces policies
- Coordinates actions across mesh
- Event bus for communication
You said: “maybe ric is for testing the network using a yang ai model and it finds the fastest path”
Reality: ✓ CLOSE! RIC = RAN Intelligent Controller
- Port 8081
- ML Engine with 2 production models: a. Anomaly Detection (92% accuracy) - finds problems b. Traffic Optimizer (88% accuracy) - finds fastest routes ← YOU WERE RIGHT!
- Provides ML intelligence to SMO and rApps
- Real-time inference (<15ms)
You said: “the nix-ide is for users to do ‘ai app building’”
Reality: ✓ EXACTLY RIGHT
- Browser-based IDE (Monaco Editor)
- 60+ Nix templates (React, Go, Python, etc.)
- AI code completion
- Instant dev environments
- No local setup needed
The “Perfection” Project - What It Is
Perfection is a mini thought experiment showing how services SHOULD work:
- ✓ One manifest - Single config file lists all services
- ✓ Two templates - Go service + Cloudflare Worker templates
- ✓ Generators - Auto-generate code for TS/Go/Rust/Python
- ✗ Single gateway - NOT DONE (smart router)
- ✓ Dashboard - Visual control center (the HTML I made)
- ✗ Policy/connectors - NOT DONE (click-to-add features)
- ✗ Ops automation - NOT DONE (auto-deploy/logging)
Foundation is solid, automation layer missing